Looks like the CDS system has had a big slowdown over the last couple days, and especially today.
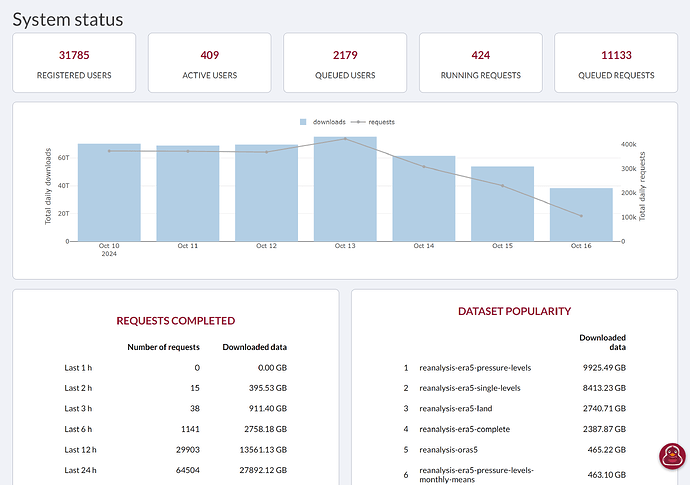
From the live CDS system status page at Live — Climate Data Store just now, Thursday Oct 17 05:20 UTC, I see:
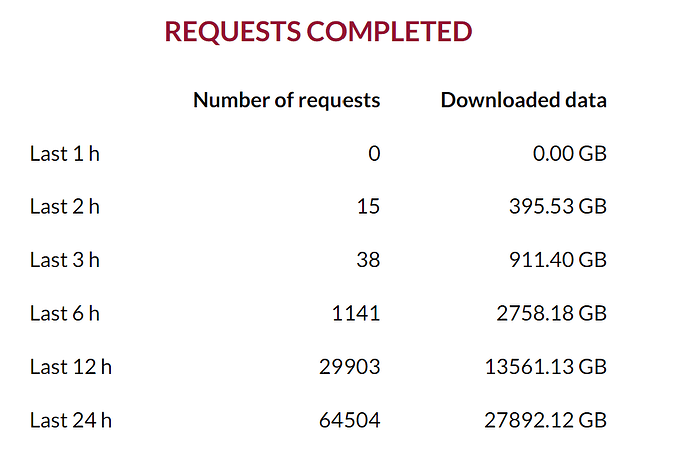
To me that looks like the completed request volume has been falling a lot over the last couple days, and especially today, with almost no data going out the last couple hours.
Given the typical queue depth, I’m guessing that’s due to the server side getting slower, not that the amount of client requests have dropped off.
Though maybe the metrics data for this dashboard is delayed, so the last couple hours or days always look low volume.
ECMWF CDS support folks, if you’re reading this:
- Do you know how up-to-date the info on that live system status page is? Is “0 requests last hour, and 15 requests last hour” a normal thing to see?
- It would be nice if the “Last n h” rows also included normalized requests and GB per hour values, to make it easier to compare speeds over time, and notice if there’s a big drop.
- Is the “requests” count here the number of requests which were issued, or completed, during that time period? I’m assuming completed. Might be nice to see the number issued, too.
- A count of “items” in addition to requests and GB might be nice too, since as I understand, the work done by the system, and thus request priority weighting and servicing time, depends more on that than total GB. Where “items” is (variables × levels × times, but not × grid cells).
- IMHO, would be nice to also see a graph of queue depth and average queue wait times, too.

