Hi Ronald,
If I download the 2025-03-16 T+3 field and plot it this is what I get:
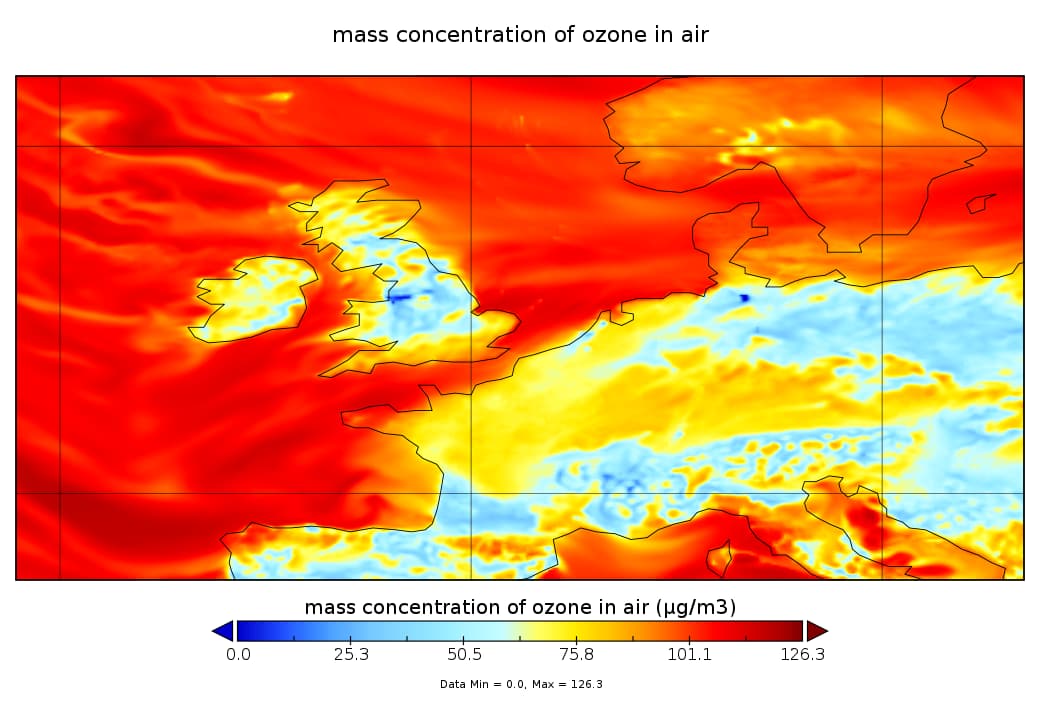
Values are around 75 ug/m3 in Northern France, which is around 35ppb at 0 Celsius. That seems roughly consistent with the web chart: Charts | Copernicus
Luke.
Hi Ronald,
If I download the 2025-03-16 T+3 field and plot it this is what I get:
Values are around 75 ug/m3 in Northern France, which is around 35ppb at 0 Celsius. That seems roughly consistent with the web chart: Charts | Copernicus
Luke.