Hi Josh,
I encountered an issue while calculating 5-quantile bounds, which are used for generating labels for an AI model. I noticed a very small but consistent difference between the quantile bounds I generated and those obtained from the official API for the same date.
Following your method, I selected a ±4-day window (i.e., 2 days on either side) over a 20-year period. Below is an example of my code for calculating tas 5-quantile bounds on November 24, 2019:
list1=[]
month=11
for year in range(1999,2019):
    for day in [20,22,24,26,28]:
        list2=[]
        for i in range(7):
            time=datetime(year=year,month=month,day=day)+timedelta(days=i)
            ds_s=ds_era5.sel(valid_time=time)
            # ds_era5 is daily ERA5 2m temperature dataset from 1999 to 2024
            list2.append(ds_s)
        list1.append(xr.concat(list2,dim='valid_time').mean(dim='valid_time'))
ds=xr.concat(list1,dim='valid_time')
quintile_bounds = ds.quantile(
                q=[ 0.2, 0.4, 0.6, 0.8],
                dim="valid_time",
                skipna=True
            )
I then downloaded the file tas_20yrCLIM_WEEKLYMEAN_quintiles_20191124.nc and subtracted it from my calculated bounds. The visualization reveals a noticeable discrepancy in the last row, while the other rows show only very minor differences. This pattern is consistent across all quantiles.
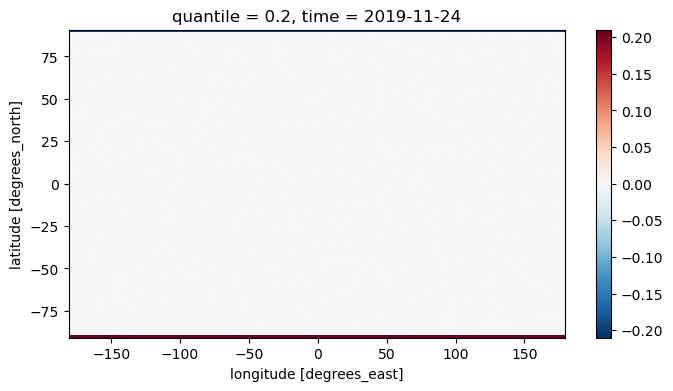
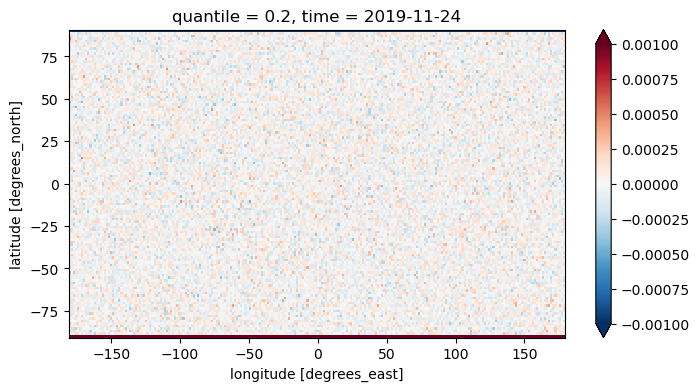
I am wondering if this could be due to how the ERA5 data was upsampled from its native 0.25-degree resolution to 1.5 degrees. When I downloaded the ERA5 data, I set the resolution directly to 1.5 degrees rather than downloading it at 0.25 degrees and upsampling locally. These small differences may affect the training set creation and model training.
Please let me know if you have any insights or suggestions.
Best regards,
Liu Can