Data source
ERA5-Land variable “total precipitation” (resolution: 1h, 1°)
Preprocessing
I created a block maxima dataset (annual maxima) using CDO chaining.
As the variable accumulates values for each day, the operator deltat was used to calculate differences of consecutive timesteps. Because the hour 1 UTC is the start of the accumulation interval, this hour should not be affected by deltat.
cdo --eccodes timmax -mergetime [ -timmax -selhour,1 [ -mergetime <monthly_files> ] -timmax -delete,hour=1 -deltat [ -mergetime <monthly_files> ] ] <new_file>
After repeating this procedure for each year for all 74 annual maxima have been merged using mergetime.
Problem specification
The patterns or artifacts occur (almost everywhere on the globe except from Antarctica) when aggregating the annual maxima along the time axis (e.g. max, mean, sum).
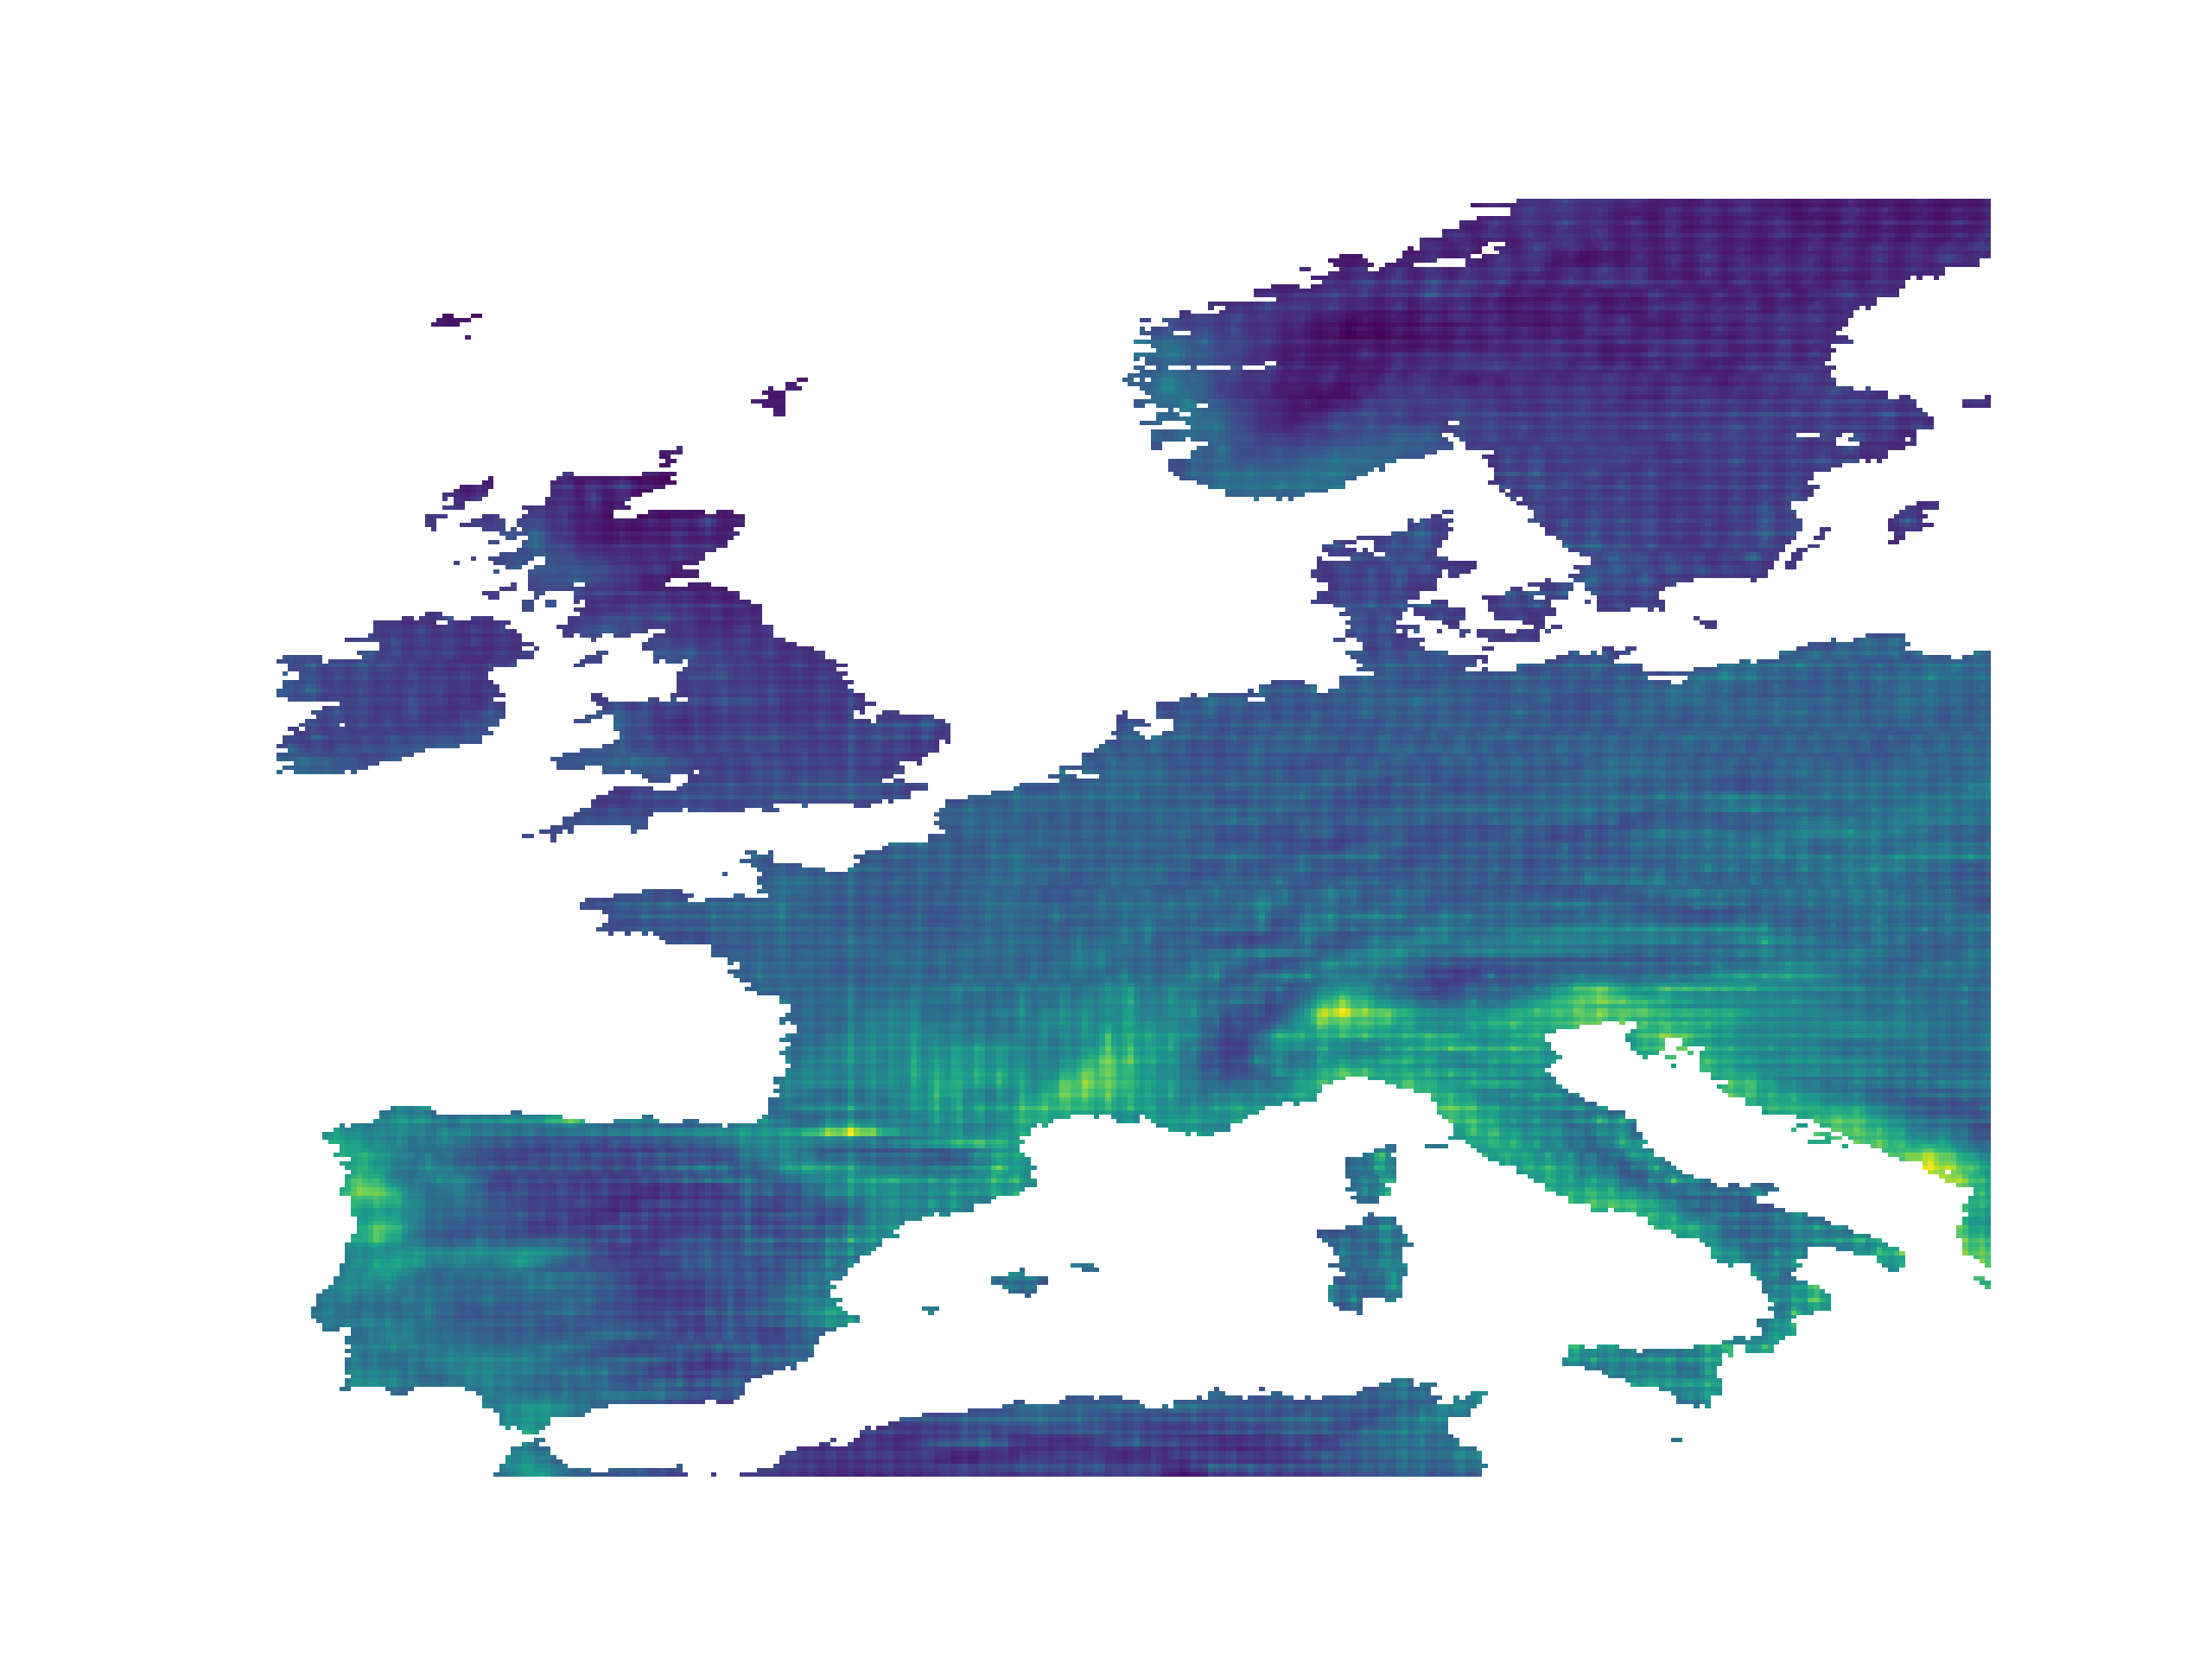
Question: Where does these artifacts come from?
I have some ideas, but could not confirm them.
- Interpolation between two geographical grids
- Rectangular grids have different types of neighbors. Direct neighbors are connected via an edge, indirect neighbors via a corner. The distance between cell centers is therefore greater in the diagonal than in the horizontal/vertical.
- downscaling/ interpolating from ERA5 data