Dear ECMWF team,
I am currently using the climatological quintile boundaries data available from the AI Weather Quest resources, and I would appreciate your guidance on two points regarding how to apply this data correctly when evaluating weekly forecasts.
- The quintile datasets (e.g. for
tas) are available at daily resolution, but my forecasts are weekly (e.g. weekly mean tas or weekly sum pr).
➤ Should I only use the Monday boundary (as in the evaluation code), or should I average the daily boundaries over the full week to match the forecast period?
- The file
pr_20yrCLIM_WEEKLYMEAN_quintiles_{time}.nc —
➤ Does it contain quintiles of weekly mean precipitation, or of weekly accumulated precipitation?
➤ If it’s weekly mean, should I compute weekly sums myself to match accumulated pr forecasts?
Thank you very much in advance for your clarification and support!
Best,
Tan Yanyan
Hi Tan,
Nice to hear from you and great that you’ve been using the climatological quintile boundaries.
Regarding your questions:
(1) You are correct that climatological datasets are at a daily-resolution. Rest assured, whilst the output is daily, each file contains weekly-aggregated statistics. For instance, a Monday start date will include Monday to Sunday averages, whilst a Tuesday start date will include Tuesday to Monday averages. You should only use the Monday data for forecasting at weeks 3 and 4 for the Quest.
(2) I have not created a pr_20yrCLIM_WEEKLYMEAN_quintiles_{time}.nc . Instead, I only save weekly sums of precip (pr_20yrCLIM_WEEKLYSUM_quintiles_{time}.nc). How and where have you been able to access weekly means of precip? When using AI WQ code to download precip. quintile climatologies, weekly-sums are already extracted so you shouldn’t need to compute weekly sums yourself.
Full details regarding quintile historical climatologies can be found at Forecast Evaluation — AI_Weather_Quest 1.0 documentation .
Let me know if you have any further questions.
Thanks,
Josh
Hi again,
Thanks for the previous clarification.
As a follow-up, I downloaded the climatological quintile boundaries for precipitation (pr) using the following code:
variable = 'pr'
quintile_clim = retrieve_evaluation_data.retrieve_20yr_quintile_clim(fc_valid_date, variable, password)
I noticed that the output states:
File '/climatologies/2025/pr_20yrCLIM_WEEKLYSUM_quintiles_20250625.nc' has been downloaded to successfully.
pr_20yrCLIM_WEEKLYMEAN_quintiles_20250625.nc
I did not manually rename anything or specify an output path, so I’m wondering:
➤ Is the file being saved with a different name (WEEKLYMEAN instead of WEEKLYSUM) locally, even though the server-side file name is correct?
➤ Could this be due to how the retrieve_20yr_quintile_clim function handles local filenames?
I just want to confirm whether the data content corresponds to weekly accumulated precipitation, and this is simply a local naming mismatch.
Thanks again!
Hi Tan,
Yes there is an error in the save name associated with precip. accumulations. I’ll get it changed now.
All downloaded precipitation will be weekly accumulations.
Code has now been changed removed error in retrieve quintile climatology function · ecmwf/AI_weather_quest@dbbc8e4 · GitHub .
You can update to latest version of AI WQ python package using:
python3 -m pip install --upgrade AI-WQ-package
Kind regards,
Josh
Hi Josh,
I have a question about how the retrieve_20yr_quintile_boundaries function constructs the climatological quintile boundaries.
From the documentation, I understand that:
“To expand the sample size to 100 observations, we include data from +/- 4 days at two-day intervals around the requested date (i.e. Thursday (day -4), Saturday (day -2), Monday (day 0), Wednesday (day 2), Friday (day 4)).”
Could you please clarify the following:
- Is the original input data at 6-hourly resolution (e.g., ERA5), and if so, how is it processed for this calculation?
- When computing the relevant weekly statistic (e.g., weekly mean for tas or mslp, weekly sum for pr),
➤ Do you first compute daily values (e.g., daily mean or sum from 6-hourly data), then aggregate into a weekly value,
➤ or do you directly compute the statistic from the full 7-day time series?
- For the 100-member sample, are these weekly statistics computed for each of the five +/- days (i.e., each centered week), or is there a different aggregation strategy?
Understanding this will help me ensure consistency when applying the same logic to evaluate model outputs.
Thanks in advance for the clarification!
Hi Tan,
All perfectly good questions.
(1) I download hourly data and average between 00 to 23 hours (inclusively) for temperature and mean sea level pressure. For precipitation, I also download hourly and work out the daily accumulation by taking 24 - 00.
(2) To compute the relevant weekly statistic, I use the daily-aggregated values.
(3) I don’t fully understand the question, but the weekly quintiles are calculated after aggregating data from +/- 4 days, over 20 years, so they considered all 100 members in one go. The code used to compute climatological quintiles can be found at AI_weather_quest/src/AI_WQ_package/compute_20yr_quintile_climatology.py at src · ecmwf/AI_weather_quest · GitHub .
I hope that helps,
Josh
Hi Josh,
I’m reviewing a script that computes weekly climatological quintiles using 20 years of daily data. In the code, the weekly average is computed using:
weekly_rolling = da.rolling(time=initial_rolling_window, center=False).mean()
As I understand, with center=False, this means the window is right-aligned, so each value is the mean of the previous 6 days plus the current day — i.e., [t-6, t].
However, I found a prior explanation that says:
“For instance, a Monday start date will include Monday to Sunday averages, whilst a Tuesday start date will include Tuesday to Monday averages. You should only use the Monday data for forecasting at weeks 3 and 4 for the Quest.”
This sounds like the weekly average is left-aligned, i.e., [t, t+6], starting on the current day and looking forward.
So my question is:
Isn’t there a mismatch between the code (which averages backward) and the explanation (which describes a forward-looking weekly average)?
If so, how should this be interpreted in the context of climatological forecast evaluation — especially when deciding which day’s average to use in week 3 or 4 forecasts?
Appreciate any clarification!
Hi Tan,
Thanks for the message.
You are correct that the calculation of weekly-aggregated statistics is right-aligned if I was to use the code provided in AI_weather_quest/src/AI_WQ_package/compute_20yr_quintile_climatology.py at src · ecmwf/AI_weather_quest · GitHub . However, I actually performed weekly statistics outside of AI WQ python package using
da.rolling(time=7,center=False).mean().shift(time=-6) # tas or mslp
or
da.rolling(time=7,center=False).sum().shift(time=-6) # pr
Hence, there is no mismatch between provided quintile climatological data and the time coordinate.
I have updated the function in the AI WQ complete_20yr_quintiles function to ensure the correct alignment of time when using this code.
Thanks, and sorry for the cause of confusion.
Kind regards,
Josh
Hi Josh,
Thanks a lot for your thoughtful response. Your clarification on the rolling window alignment helped resolve my confusion.
Much appreciated!
Thanks,
Yanyan Tan
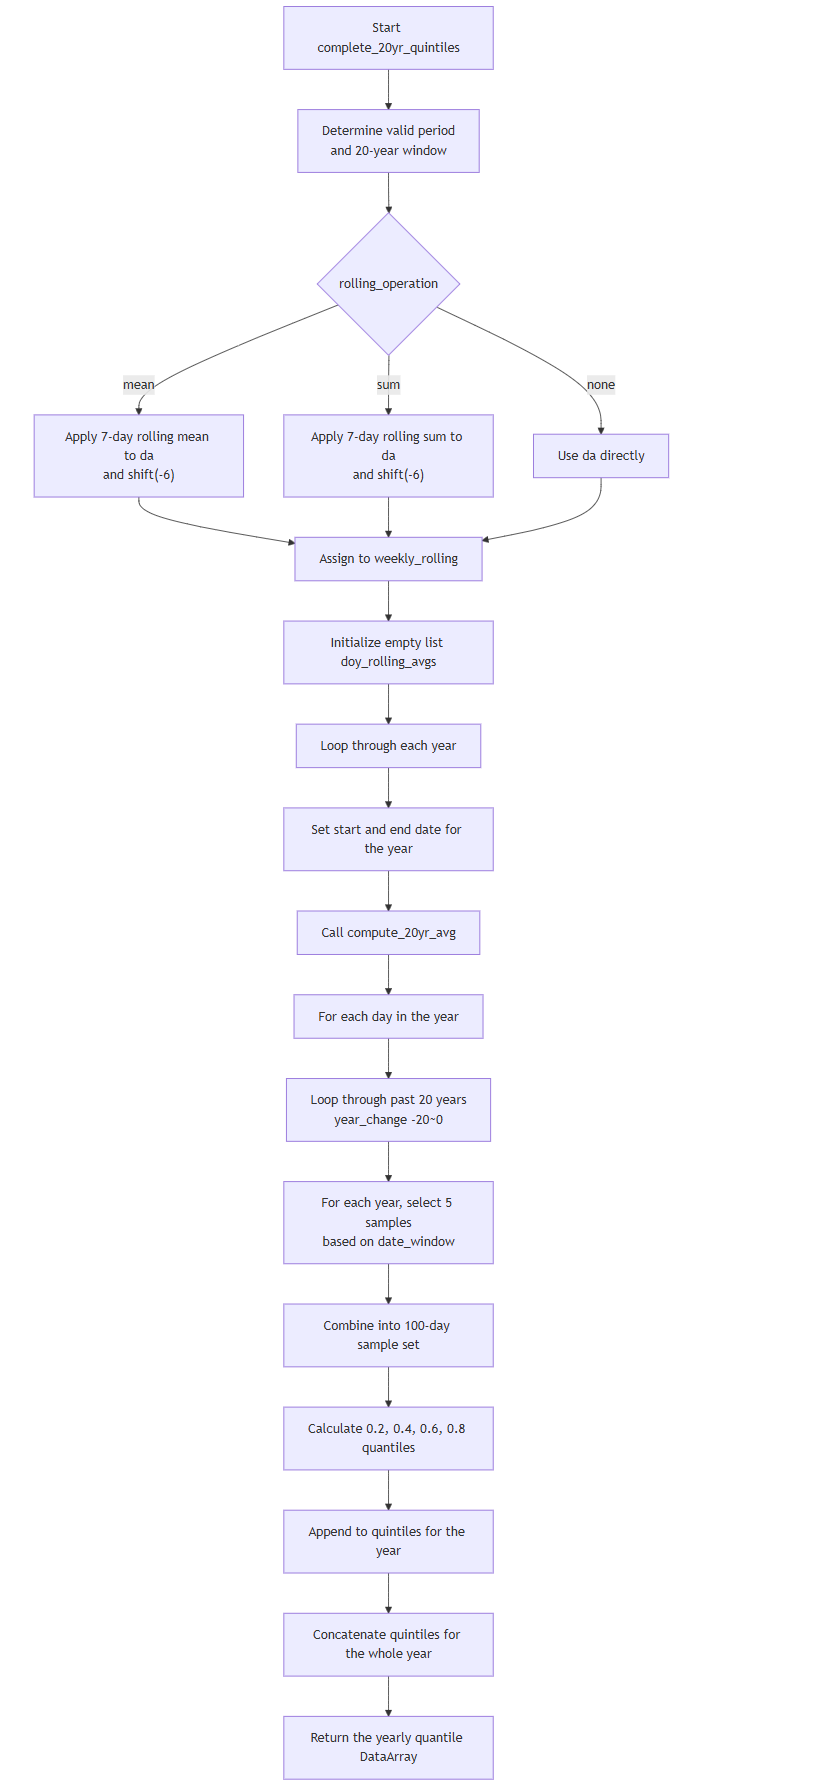
Similar to that.
Essentially, work out weekly-aggregated statistic (as I use the none option in complete_20yr_quintiles), calculate the time span that a 20-year climatology can be computed, loop through each year and compute quintiles after selecting current day, +/- 20 years and +/- 4 days at 2-day intervals. Save output as a daily dataset, i.e. historical quintiles are saved for every day.