Hello, I want to convert the y-axis tick labels from m to km in my Pcolormesh plot (see above). I am not sure how this can be done.
Is there a kwarg in Pcolormesh settings where one can type in the y-tick labels manually? or is there some way you can divide the y with 1000?
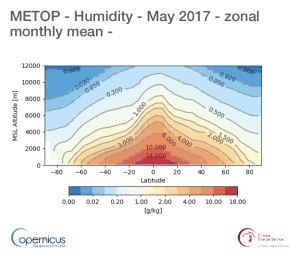
Code used to plot:
ct.cdsplot.pcolormesh(data_con,
fig = fig,
levels = lvls, colors=clr,
x='lat',
y='height',
ylim=[0,1.2e4],
cbar_kwargs={'orientation':'horizontal','shrink':0.78,'label':'[g/kg]'})
link to full application: https://sis-dev.climate.copernicus.eu/toolbox-editor/1474/uc1-humidity-and-its-variability-over-latitude-and-height
Thank you,
Huayuan.