Hello,
I am currently working with both temperature and SPEI data from Cordex-EUR11.
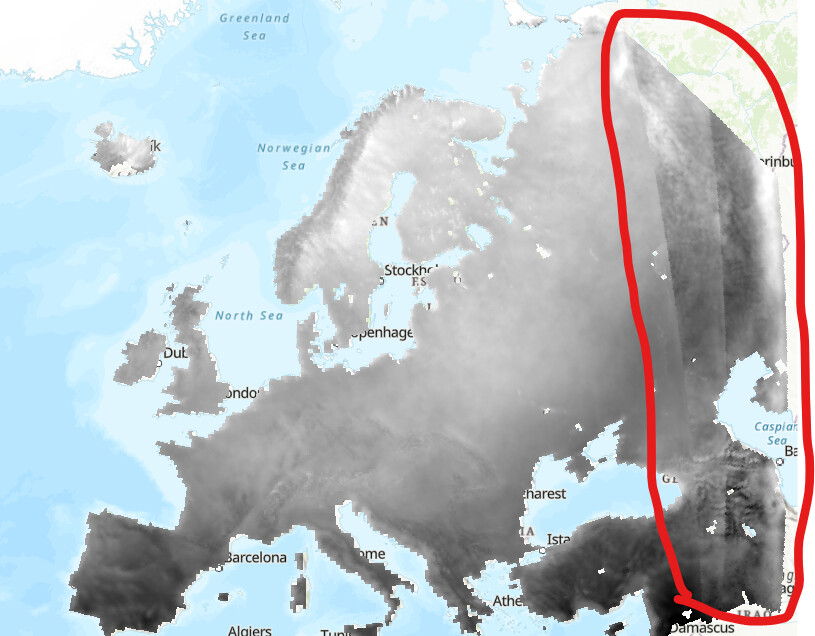
All is working well, but I’ve noticed some kind of unnatural splits in the data values which form longitudinal lines in the Eastern part of the study area.
I was wondering if someone could shed light on the potential origin, and whether the data are still reliable given these seemingly artificial differences in data values.
For example, here’s the average SPEI-6 between 2067 and 2069 under RCP85: