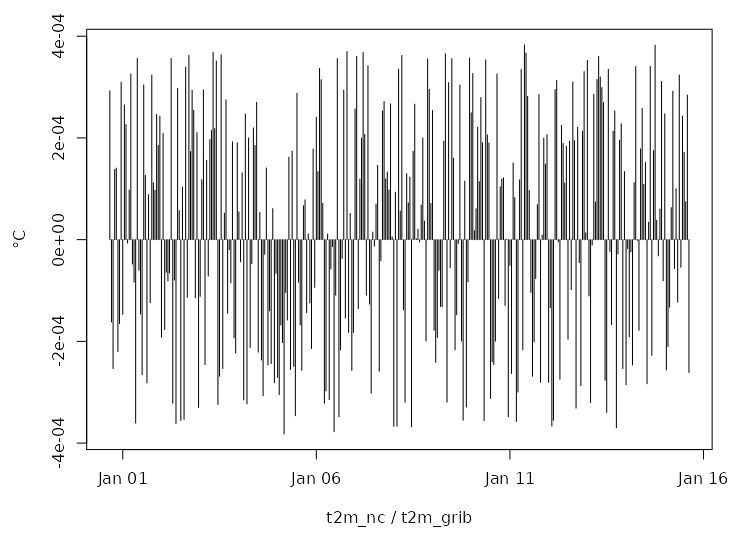
We're looking at ERA5-LAND 2m-temperature, but can't explain differences between GRIB and NetCDF files downloaded at https://cds.climate.copernicus.eu/cdsapp#!/dataset/reanalysis-era5-land?tab=form with another NetCDF file acquired from the CDS API (via Python client at https://cds.climate.copernicus.eu/api/v2).
Here are 3 time-series in °C from the 3 separate files for 1990-01-01 UTC times at location X=-122.0728 Y=39.75376:
                    date   t2m_api    t2m_nc  t2m_grib
 1: X1990.01.01.00.00.00 13.221094 13.237744 13.237451
 2: X1990.01.01.01.00.00 11.665186 11.681625 11.681787
 3: X1990.01.01.02.00.00 10.072168 10.095596 10.095850
 4: X1990.01.01.03.00.00  9.000879  8.965128  8.964990
 5: X1990.01.01.04.00.00  9.196192  9.182172  9.182031
 6: X1990.01.01.05.00.00  8.310938  8.317065  8.317285
 7: X1990.01.01.06.00.00  7.488183  7.531720  7.531885
 8: X1990.01.01.07.00.00  5.521875  5.556852  5.556543
 9: X1990.01.01.08.00.00  5.076074  5.118164  5.118311
10: X1990.01.01.09.00.00  5.546777  5.577560  5.577295
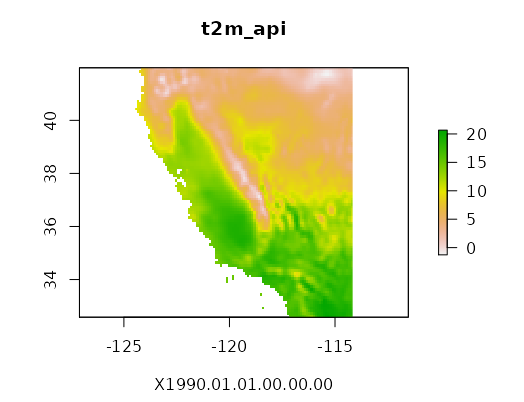
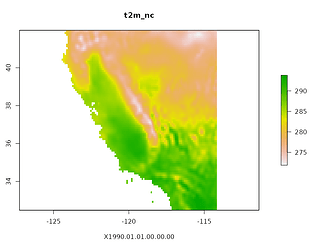
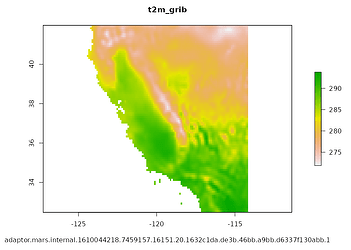
Below are plots of the 3 files at 1990-01-01 00:00 UTC. They have slightly different spatial extents (and projection for the GRIB), which maybe explain the problem (?):
t2m_api
> extent(r)
class      : Extent
xmin       : -124.466
xmax       : -114.165
ymin       : 32.581
ymax       : 41.981
t2m_nc
> extent(r)
class      : Extent
xmin       : -124.46
xmax       : -114.16
ymin       : 32.48
ymax       : 41.98
t2m_grib
> extent(r)
class      : Extent
xmin       : -124.46
xmax       : -114.16
ymin       : 32.48
ymax       : 41.98
API method (in °C):
GUI NetCDF format (in K):
GUI GRIB format (in K):
We use R raster::extract() to overlay the point location to the rasters (but we have the same results in QGIS).
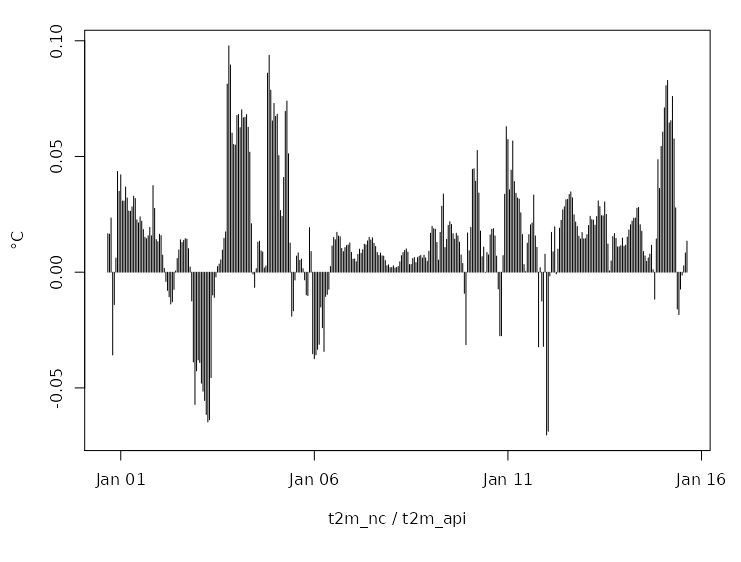
Differences between the 2 NetCDF files (API vs. GUI):
Differences between NetCDF and GRIB files (GUI):
Is there any reason why we see small differences between the separate files? Max difference is in the order of 0.1°C (between API and GUI) over the month of January 1990, but this is a little concerning for reproducibility's sake.
