Dear all,
I have downloaded daily ERA5 potential evaporation (evp) data from 1981 to 2016.
The bounding box is longitude -58.0 to -73.0 and latitude -8.0 to -21.0.
This region is Madeira River Catchment in Amazon.
From ERA5 documentation units are in meter and and its convertion to mm was done by multiplying it to 1000.
The same procedure was done to precipitation data.
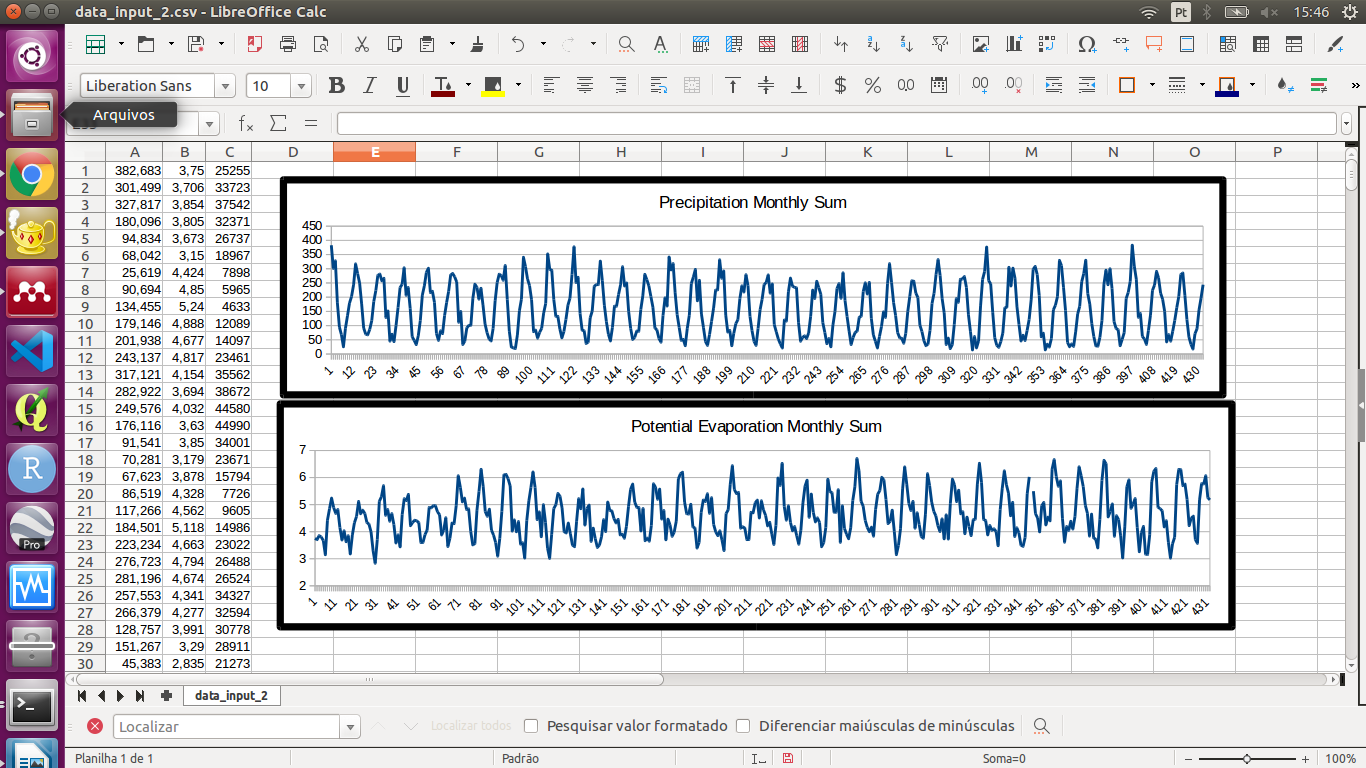
Attached one plot of both time series of monthly accumulated of precipitation and potential evaporation.
As one can notice potential evaporation (ranging from 3 to 6 mm) is much lower than precipitation (ranging from 0 to 400 mm).
According to Maeda (2017) mean annual rainfall is 1716 mm year−1 and mean annual actual evapotranspiration is 1132 mm year−1 for Madeira.
Would you have any clue for this?
Best regards
References:
Maeda, E. E., Ma, X., Wagner, F. H., Kim, H., Oki, T., Eamus, D., & Huete, A. (2017). Evapotranspiration seasonality across the Amazon Basin. Earth System Dynamics.
Dear Vitor,
As far as I understand, potential evaporation, total precipitation and evapotranspiration are different parameters. The definitions are available at ECMWF parameter database.
If you have any further questions, I can certainly ask for our scientist for clarification.
Kind regards,
Xiaobo
Dear Vitor,
Did you get those total precipitation amounts just via multiplying by 1000? Because when I do a similar calculation for another domain, my values are so small. So I have doubt on the unit of total precipatition. Is it mm or mm/day?
Thanks,
Tufan
Hello Xiaobo Yang and Vitor,
How did you resolve the matter here? I have the same issue working in Nigeria. The evapotranspiration is = 0 in most parts of the country, especially in the northern pârt.
I'll appreciate your answers
Pius
Dear all,
Have you received any response regarding this issue?
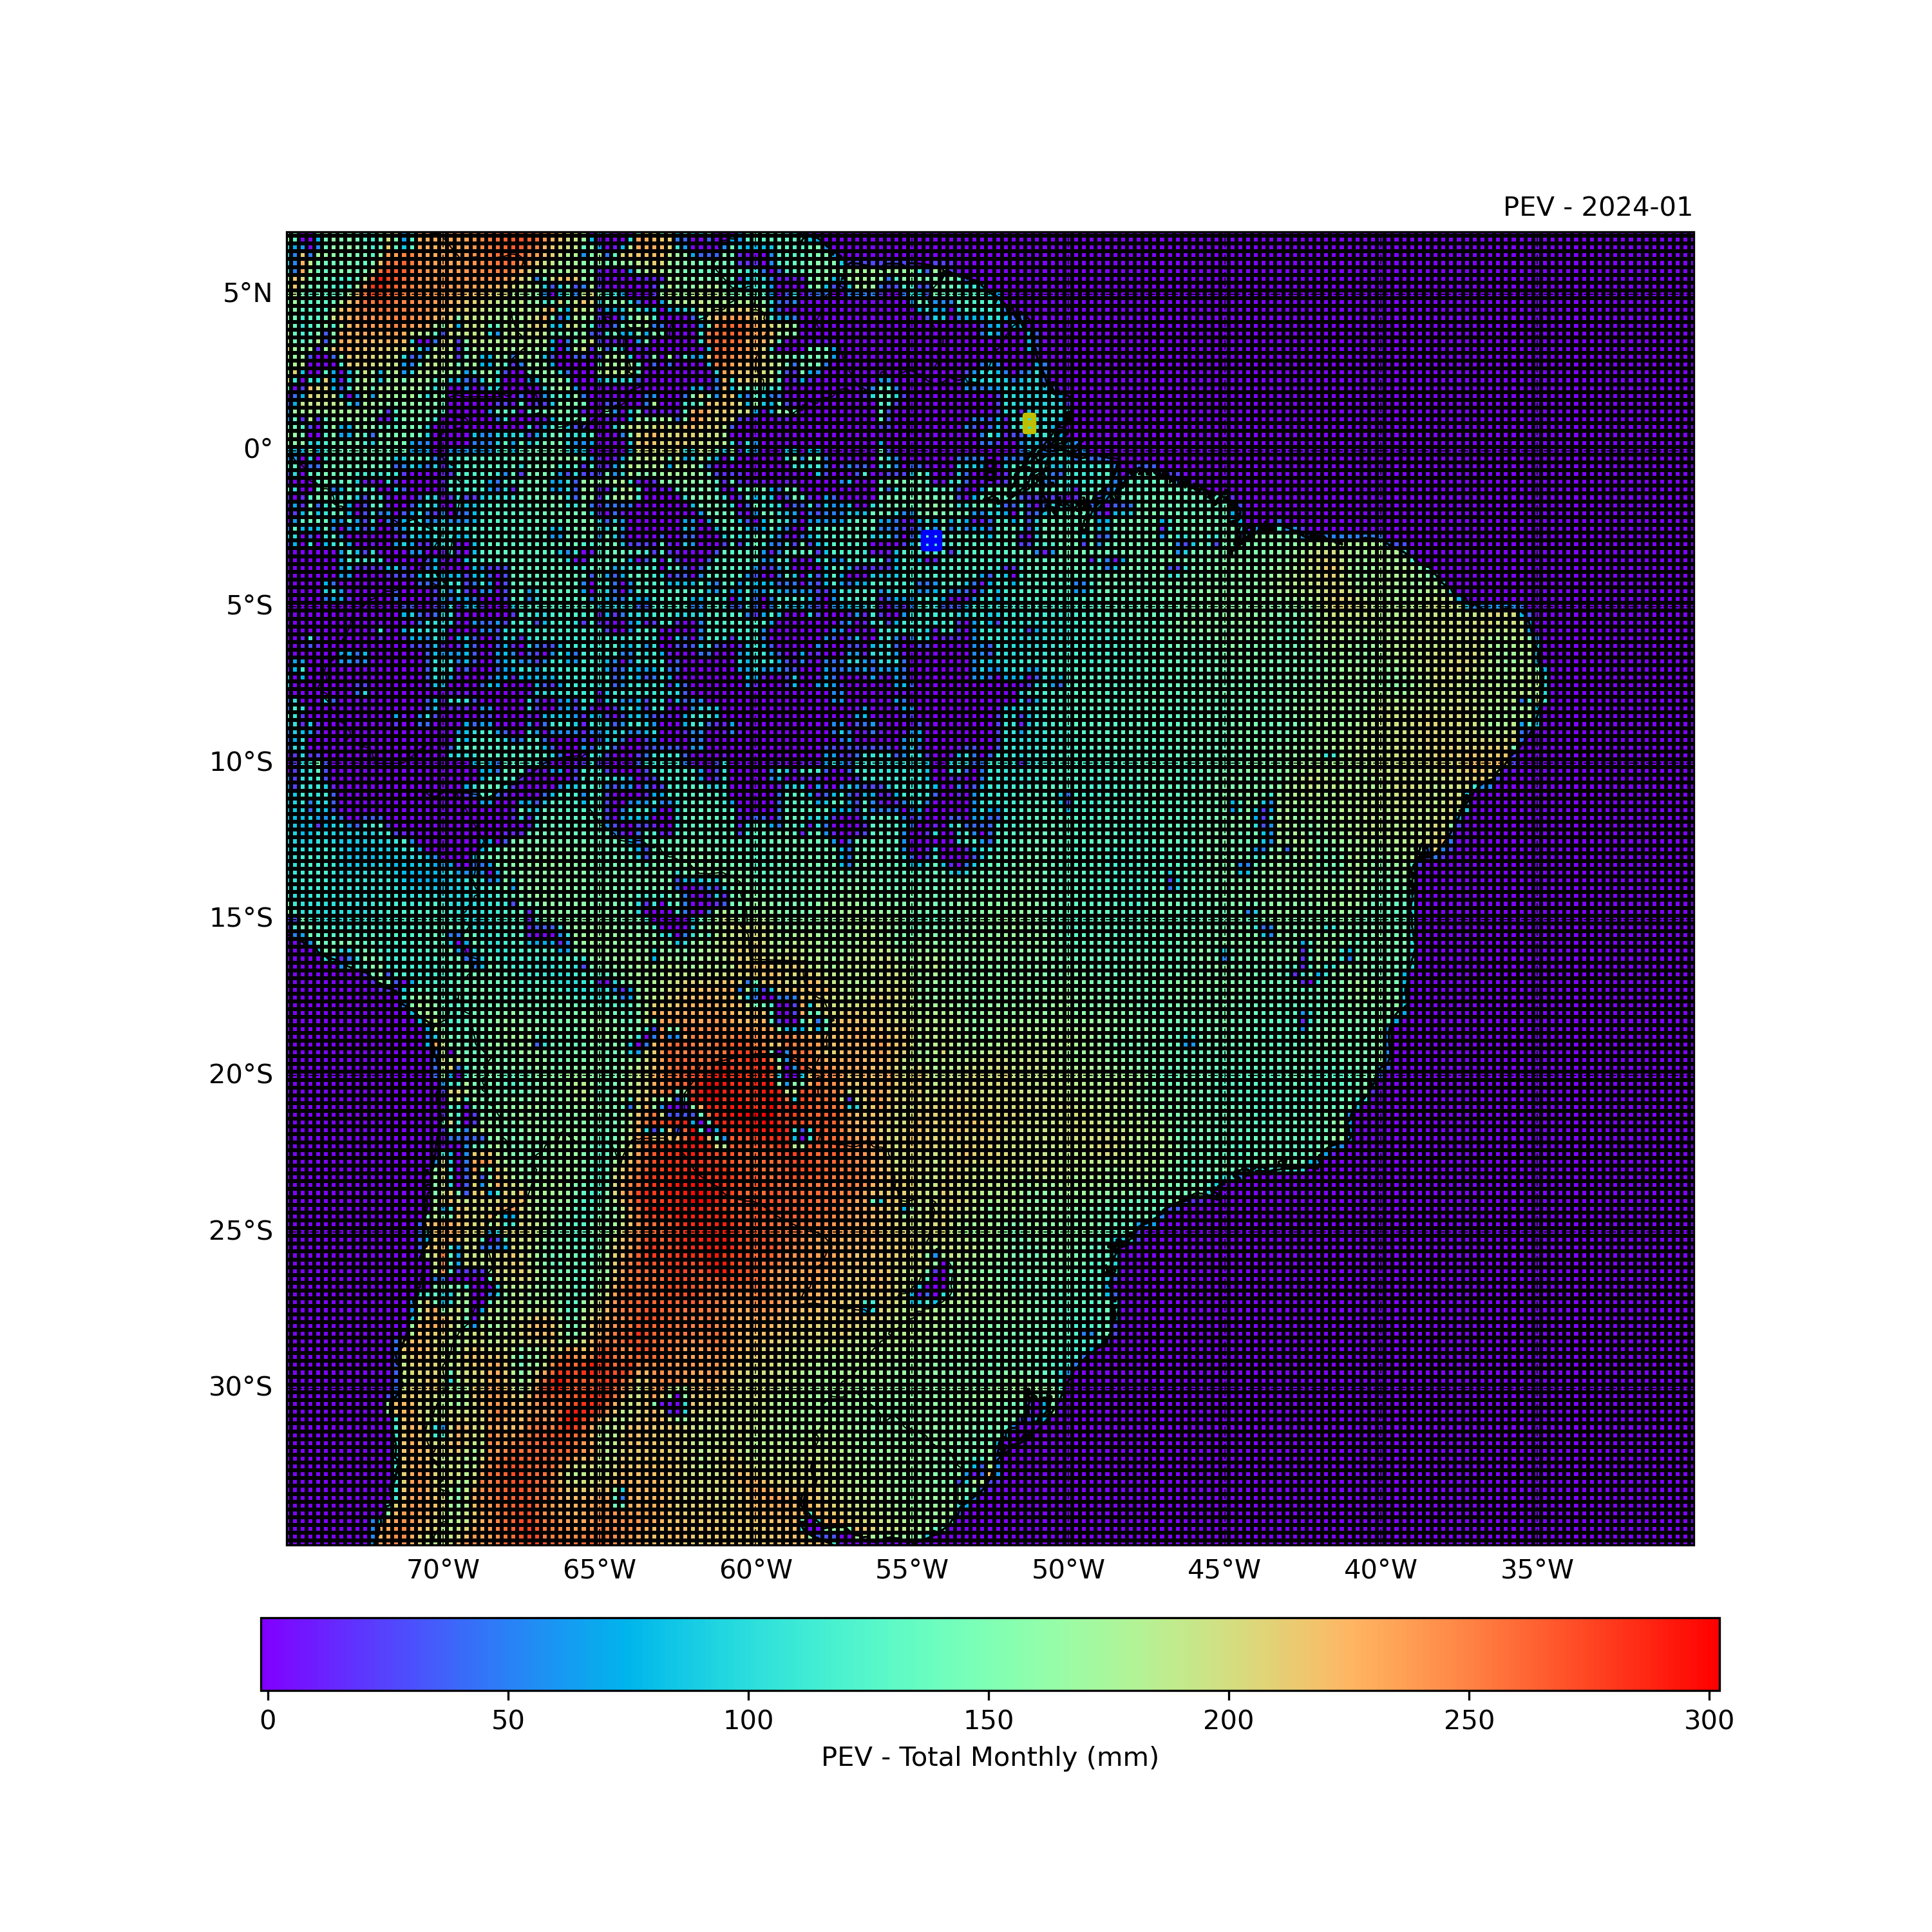
I am working with hourly PEV data for Brazil from ERA5 and aggregating it into total monthly values (mm). I noticed minimal values over the Amazon Basin, parts of Bolivia and Peru, as well as some grid points in MG and BS (Brazil) and in the region near the borders of Brazil, Paraguay, and Argentina.
I created a GIF for all of January in the study period, but these constant values appear in all months. Could this be a data error, or is there a valid explanation for it?
I would appreciate any insights on this matter.
Best regards,
William Cossich
Link for giff: https://drive.google.com/file/d/1pnY7zgg0gSq4lcRmElGZHmKUDwwqGtzm/view?usp=sharing
I found an explanation on the ERA5 documentation website that may provide a possible cause for the issue, but no additional details are given:
“The Potential Evaporation field (pev, parameter Id 228251) is largely underestimated over deserts and high-forested areas. This is due to a bug in the code that does not allow transpiration to occur in the situation where there is no low vegetation.” (ERA5: data documentation - Copernicus Knowledge Base - ECMWF Confluence Wiki)
Could someone from the ERA5 team provide a more detailed explanation of this bug in the code?