Dear all,
I have found a potential inconsistency in the Thermal Net Radiation. The description for this variable in ERA5 says:
This parameter is accumulated over a particular time period which depends on the data extracted. For the reanalysis, the accumulation period is over the 1 hour ending at the validity date and time
The description for this variable in ERA5 LAND says:
Accumulated field from the beginning of the forecast time to the end of the forecast step.
However, when plotting these data, they look different. Let me show it:
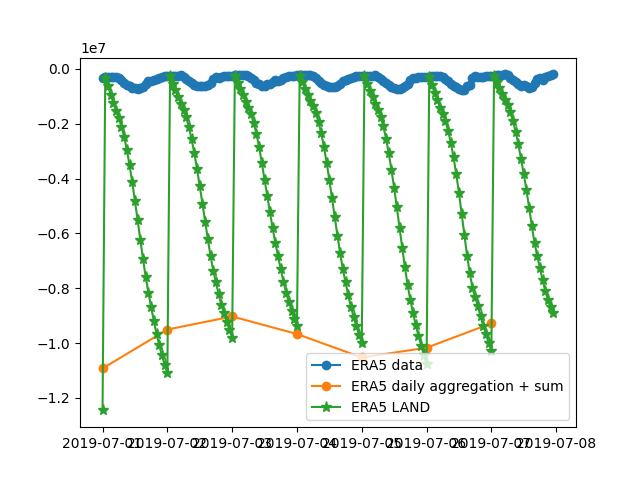
- Blue line is ERA5 hourly data for Surface Net Thermal Radiation
- Orange line is the same data, but resampled to a daily resolution by adding all the values
- Green line with stars is ERA5 LAND hourly data for the same variable. This is clearly a cumulative curve, as it shows a strong discontinuity when the date changes.
Is this a bug? Am I missing something?
Thanks.