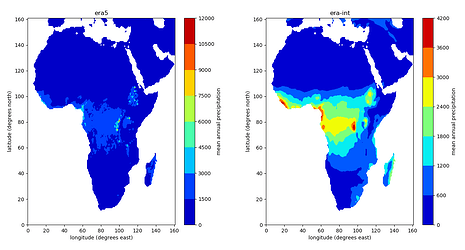
Hi Jessica,
I am Ervin, the colleague who looked into these rain bombs.
I have tried to create a simple filtering, that would cap these extreme single grid values, but unfortunately these rain bombs are not easy to remove 'correctly' at all.
These are single grid point spikes in the data. They (as mentioned earlier above) tend to appear over high/extensive orographical areas, maybe up to few times a year (in the most extreme cases/points even 10% of the year).
But there is no exact rule on what is a 'too high' single point outlier and what is still a physically reasonable one.
I have analysed the extended range ENS precipitation fields (24-hour totals), which has a similar resolution and does not suffer from rainbombs, in order to see how big outlier single grid point values are still physically possible. And in fact there are rather surprisingly high single value cases.
As a good assumption, one can use the 50 mm as a generic threshold though. So, taking all the neighbouring grid points (in the original ERA5 grid) and if the value is higher by at least 50 mm than all the neighbours, then simply cut this outlier to the maximum value amongst the neighbours. This would be done on the 24-hour fields, for all the days and for all the grid points, as I have been working on those.
This 50 mm, I have found to be working quite well for all value ranges. For the small values, line outlier points when all neighbours are below 0.1 mm (so basically a single point precip), the highest 'real' value of this kind I saw in the extended range ENS was ~30 mm. For the <1 mm case, the highest I have found was ~60 mm, for <10mm it was ~100mm, for <50mm it was 120-150mm, for <200mm it was 250-300mm and so on. So, as you can see, the 50mm is a good assumption for the 24-hour totals.
Then the next question is how to correct the original hourly values based on the 24-hour, in case you wanted to use 1-3-6-12-hourly values, not just 24-hourly. I have not actually done this, but as a simple approach one could replace all the hourly values by the values at the neighbour which had the maximum in the 24-hour data (in case of an outlier point). Alternatively, one should find the equivalent cut-off threshold for the other accumulation periods (1-, 3-, 6-, 12-hour). I do not know at all, how they translate from the 50mm / 24-hour.
So, as a summary, I suggest you do a correction on the 24-hour values by cutting off outliers above 50 mm and then applying the correction to the hourly data (if needed) as above. This will remove most of the rain bombs (although not all as some smaller than 50mm outliers will of course still be rain bombs) and probably remove only very few real outlier cases which are not rain bombs.
Let me know if this makes sense to you and how you are getting on with it and also what the corrected ERA5 result looks like in your original comparison.
Cheers, Ervin
