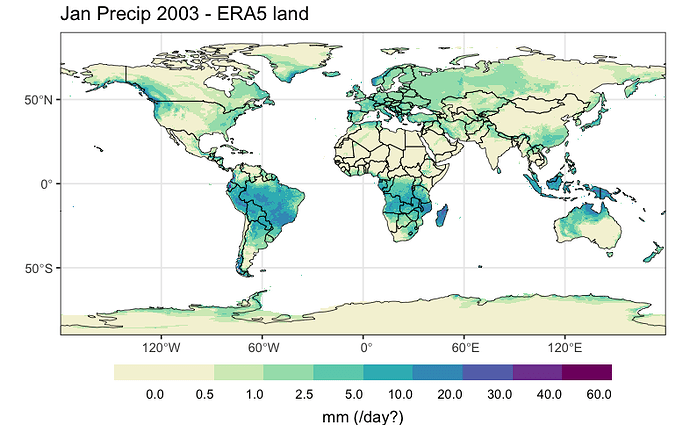
I’m doing some processing of ERA5-land monthly precipitation data, and am confused by some of the values I’m getting. My understanding based on the documentation is that the values are provided in m/ monthly daily averages - so to get the total precipitation for the month, you need the value * n days in the month. This calculation typically gives me reasonable looking values - e.g., for Jan 2003 I’m currently seeing values of 0.001-0.003m on the U.S. east coast. Multiplied across 31 days this gives nice total of 31-93mm/month, or 1.2 - 3.6in. Very reasonable.
However, elsewhere in the data (many in Colombia, but other countries as well), I’m seeing extremely high values above 0.14m. Averaged across the month this comes to 4.34m in a single month, and across the year I’m getting grid cells with upwards of 40m. This does not seem realistic. Overall it’s a relatively small number of grid cells (<0.2% of the total are above 10m/year), but it’s still a lot to just be outliers, and it’s enough to make me wonder if I’m misunderstanding the units or conversion.
Here’s an example of the results I’m getting - note that this data was downloaded as a netcdf from CDS. The only manipulation I’ve done (other than binning for plotting) is rotating to -180:180 and multiplying by 1000 for m->mm.
Would appreciate any thoughts on these high values and whether I’m correctly interpreting the temporal units.
