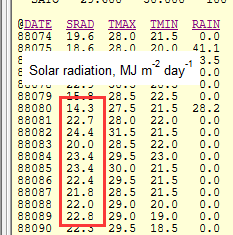
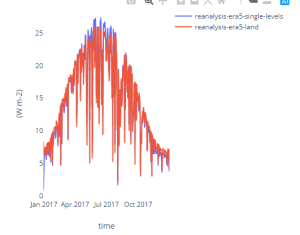
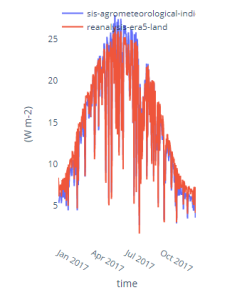
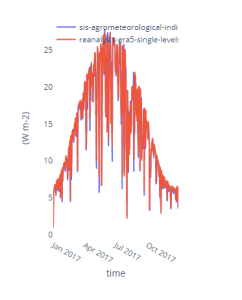
I want to calculate daily solar_radiation_flux from 2019 to present by 'surface_solar_radiation_downwards‘ in era5-land dataset. But the result is higher in winter and lower in summer.
import cdstoolbox as ct
@ct.application(title='Points data query')
@ct.output.livefigure()
#@ct.output.download()
def application():
srad1 = \
ct.catalogue.retrieve(
'reanalysis-era5-land',
{
#'product_type': 'reanalysis',
'variable': 'surface_solar_radiation_downwards',
'grid': ['0.1', '0.1'],
'year': ['2017'],
'month': [
'01', '02', '03', '04', '05', '06',
'07', '08', '09', '10', '11', '12'
],
'day': [
'01', '02', '03', '04', '05', '06',
'07', '08', '09', '10', '11', '12',
'13', '14', '15', '16', '17', '18',
'19', '20', '21', '22', '23', '24',
'25', '26', '27', '28', '29', '30',
'31'
],
'time': [#'00:00','06:00','12:00','18:00'
'00:00', '01:00', '02:00',
'03:00', '04:00', '05:00',
'06:00', '07:00', '08:00',
'09:00', '10:00', '11:00',
'12:00', '13:00', '14:00',
'15:00', '16:00', '17:00',
'18:00', '19:00', '20:00',
'21:00', '22:00', '23:00',
],
'area':[53.560860,73.557701,13.159306,134.773926]
}
)
srad2 = \
ct.catalogue.retrieve(
'reanalysis-era5-single-levels',
{
'product_type': 'reanalysis',
'variable': 'surface_solar_radiation_downwards',
'grid': ['0.1', '0.1'],
'year': ['2017'],
'month': [
'01', '02', '03', '04', '05', '06',
'07', '08', '09', '10', '11', '12'
],
'day': [
'01', '02', '03', '04', '05', '06',
'07', '08', '09', '10', '11', '12',
'13', '14', '15', '16', '17', '18',
'19', '20', '21', '22', '23', '24',
'25', '26', '27', '28', '29', '30',
'31'
],
'time': [#'00:00','06:00','12:00','18:00'
'00:00', '01:00', '02:00',
'03:00', '04:00', '05:00',
'06:00', '07:00', '08:00',
'09:00', '10:00', '11:00',
'12:00', '13:00', '14:00',
'15:00', '16:00', '17:00',
'18:00', '19:00', '20:00',
'21:00', '22:00', '23:00',
],
'area':[53.560860,73.557701,13.159306,134.773926]
}
)
srad3 = \
ct.catalogue.retrieve(
'sis-agrometeorological-indicators',
{
'variable': 'solar_radiation_flux',
'statistics': '24_hour_mean',
'year': '2017',
'month': [
'01', '02', '03', '04', '05', '06',
'07', '08', '09', '10', '11', '12'
],
'grid': ['0.1', '0.1'],
'area':[53.560860,73.557701,13.159306,134.773926]
}
)
lon=125.090837
lat=45.800623
srad1 = ct.geo.extract_point(srad1, lon=lon, lat=lat)
srad2 = ct.geo.extract_point(srad2, lon=lon, lat=lat)
srad3 = ct.geo.extract_point(srad3, lon=lon, lat=lat)
srad1 = ct.cube.resample(srad1, freq='day', dim='time',how='mean', closed='right')
srad2 = ct.cube.resample(srad2, freq='day', dim='time',how='mean', closed='right')
#srad3 = ct.cube.resample(srad3, freq='day', dim='time',how='mean', closed='right')
srad1 = srad1*24/3600*2
srad2 = srad2/12
srad3 = srad3/12
scatter_kwargs1 = {
'mode': 'lines',
'yaxis': 'y1',
'name': 'reanalysis-era5-land',
}
scatter_kwargs2 = {
'mode': 'lines',
'yaxis': 'y1',
'name': 'reanalysis-era5-single-levels',
}
scatter_kwargs3 = {
'mode': 'lines',
'yaxis': 'y1',
'name': 'sis-agrometeorological-indicators',
}
srads = ct.chart.line(srad1,scatter_kwargs=scatter_kwargs1)
srads = ct.chart.line(srad2,fig=srads,scatter_kwargs=scatter_kwargs2)
srads = ct.chart.line(srad3,fig=srads,scatter_kwargs=scatter_kwargs3)
return srads