How to display non rounded contour label in contour plot

Hi!

I would like to know, if it is possible to display the non-rounded value of contours in ct.cdsplot.contour_plot() to display as contour labels. 

I used the following code: 

ct.cdsplot.contour_plot(
data_con,
fig = fig_pc,
contour_levels=[0.005,0.02,0.05,0.2,0.5,1.,2.,3.,4.,6.,10., 14.],
contour_levels_colors=['slategray','slategray','slategray'],
clabel_kwargs = {'fontsize':'10', 'colors': 'blue'},
xlabel='Latitude',
ylabel='MSL Altitude [m]',
title=f'METOP - Humidity - {month} 2017 - zonal monthly mean -')

to plot:

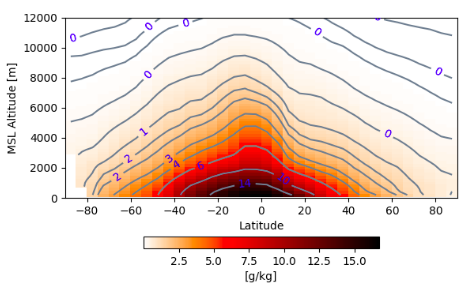
As you can see, the values of the contours are rounded in the labels.

The rest of the workflow can be found here: https://sis-dev.climate.copernicus.eu/toolbox-editor/1474/uc1-distribution-of-humidity-and-variability-over-latitude-and-height

Best regards,

Huayuan

Dear Huayaun,

You can specify the string to display for each contour level by specifying the "fmt" kwarg inside the "clabel_kwargs".

For example:

clabel_kwargs = {
            'fontsize':'10',
            'colors': 'blue',
            'fmt': {
                0.002: '0.002',
                0.005: '0.005',
                0.01: '0.01',
                0.02: '0.02',
                0.05: '0.05',
                0.1: '0.1',
                0.2: '0.2',
                0.4: '0.4',
                0.6: '0.6',
                1: '1',
                1.5: '1.5',
                2: '2',
                2.5: '2.5'
            } 
            },

Here is the app you are working on with the full labels on one of the two plots: https://sis-dev.climate.copernicus.eu/toolbox-editor/112/uc1-distribution-of-humidity-and-variability-over-latitude-and-height
let me know how you get on with adding the labels to the second plot.

Regards.

Vivien


Thank you Vivien!

It works perfectly