Hello everyone,
I might find some discrepancies in the evaporation data for the year 2023 in ERA5-Land. It appears that the values for this year are much “weaker” compared to other years. However, when checking the data from the “ERA5 monthly averaged data on single levels”, the evaporation seems to return normal.
I have included some figures to visually represent this issue:
-
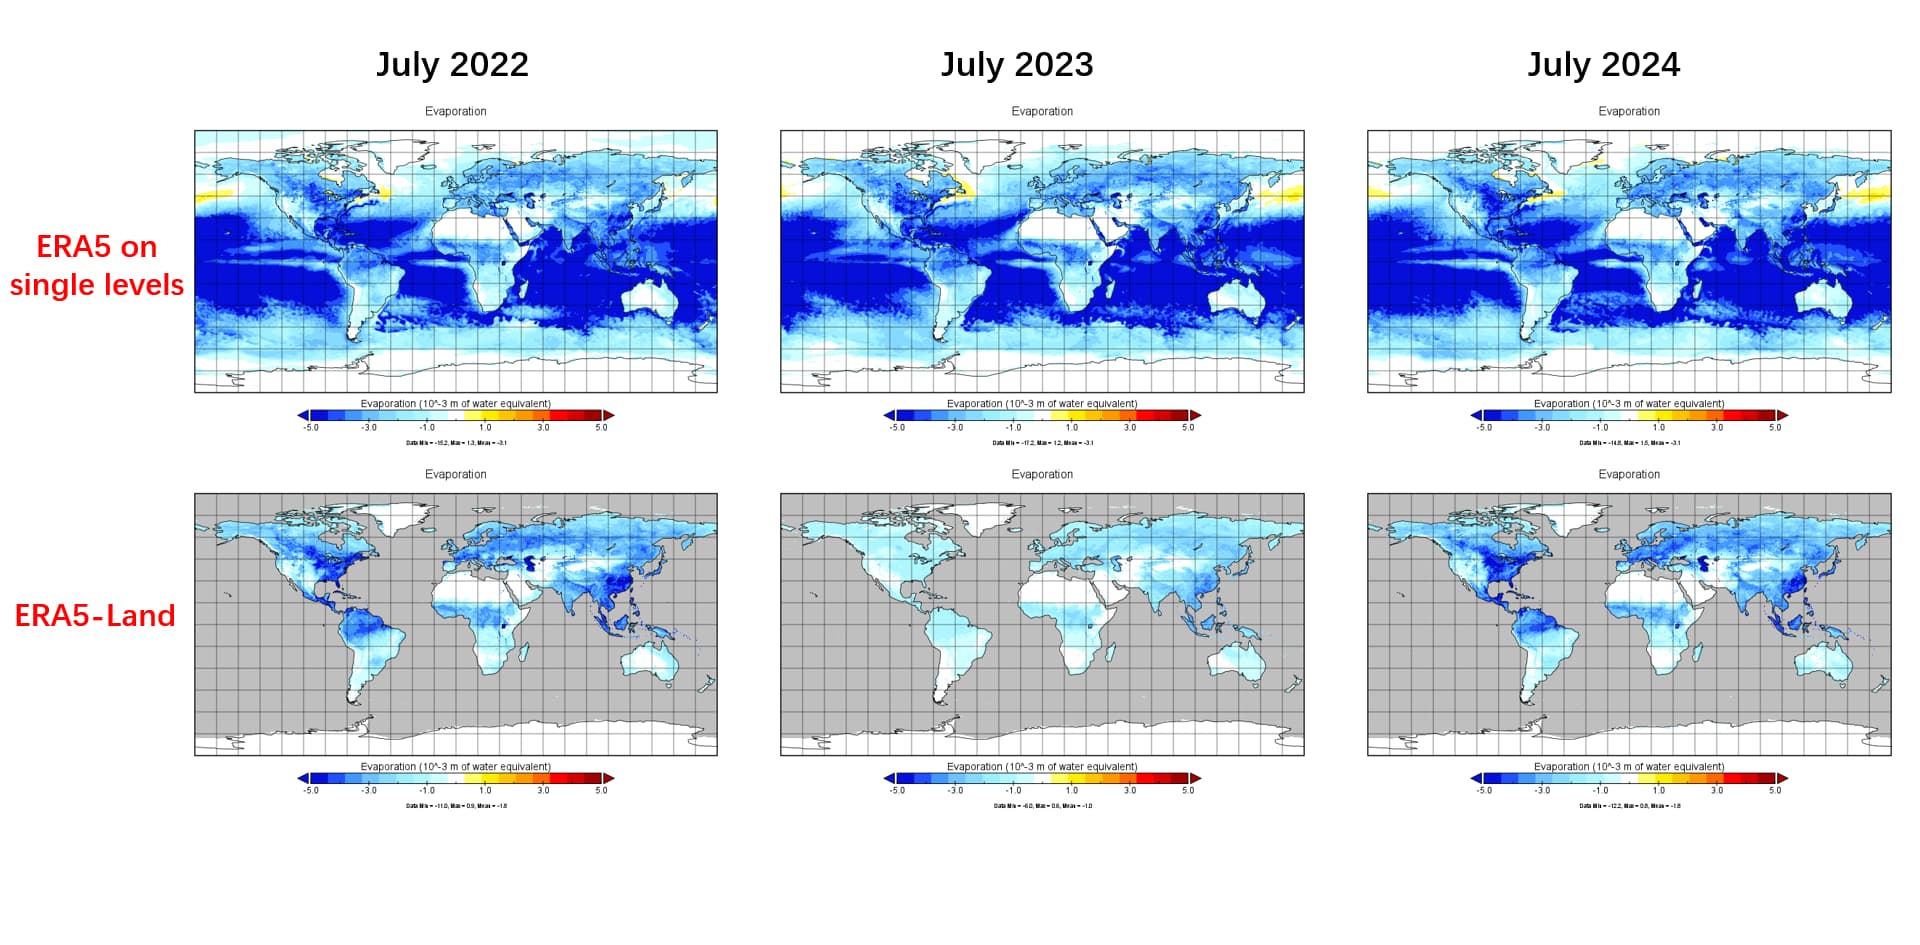
Fig.1 showcases the global map of raw evaporation data in July for the years 2022, 2023, and 2024, sourced from ERA5-Land and “ERA5 monthly averaged data on single levels”, respectively. Using the same colorbar, you can see the color for July 2023 in ERA5-Land appears noticeably faded in comparison to others.
-
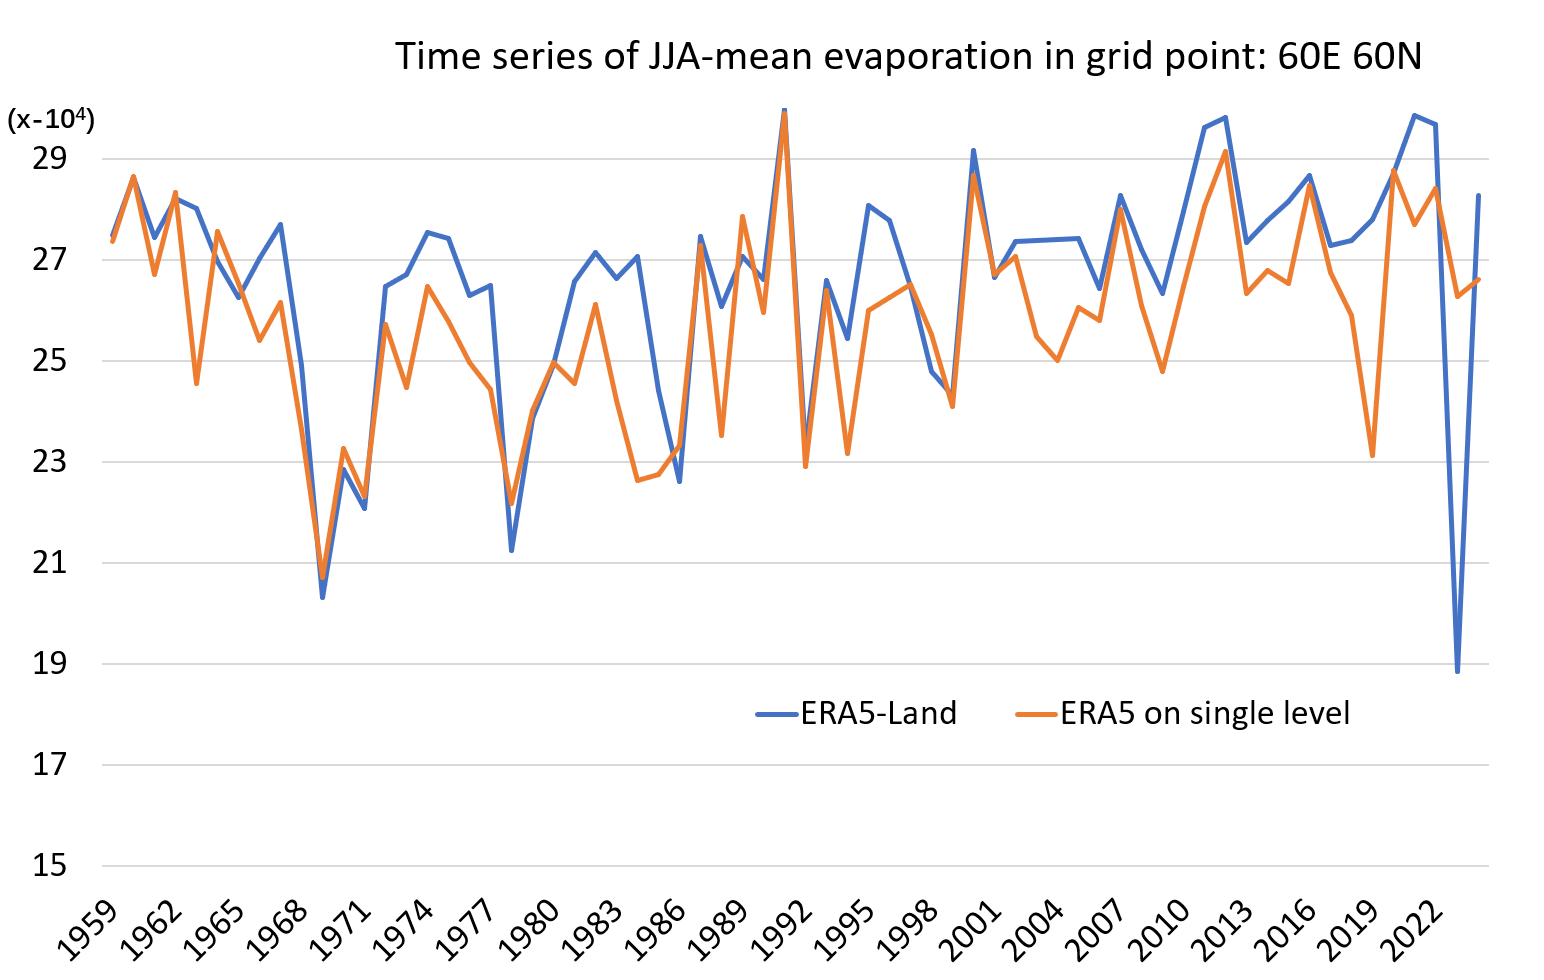
Fig.2 displays the time series of JJA mean evaporation for a specific grid point (60N, 60E) from 1959 to 2024. The outlier in 2023 on the blue line ERA5-Land data, is clearly visible.
I am uncertain if this discrepancy is indicative of a data quality issue specific to the field of evaporation for the year 2023 in ERA5-Land. I would greatly appreciate any information or discussions on this matter.
Best regards,
Linyuan