Dear all,
we appreciate these great resources for our research!
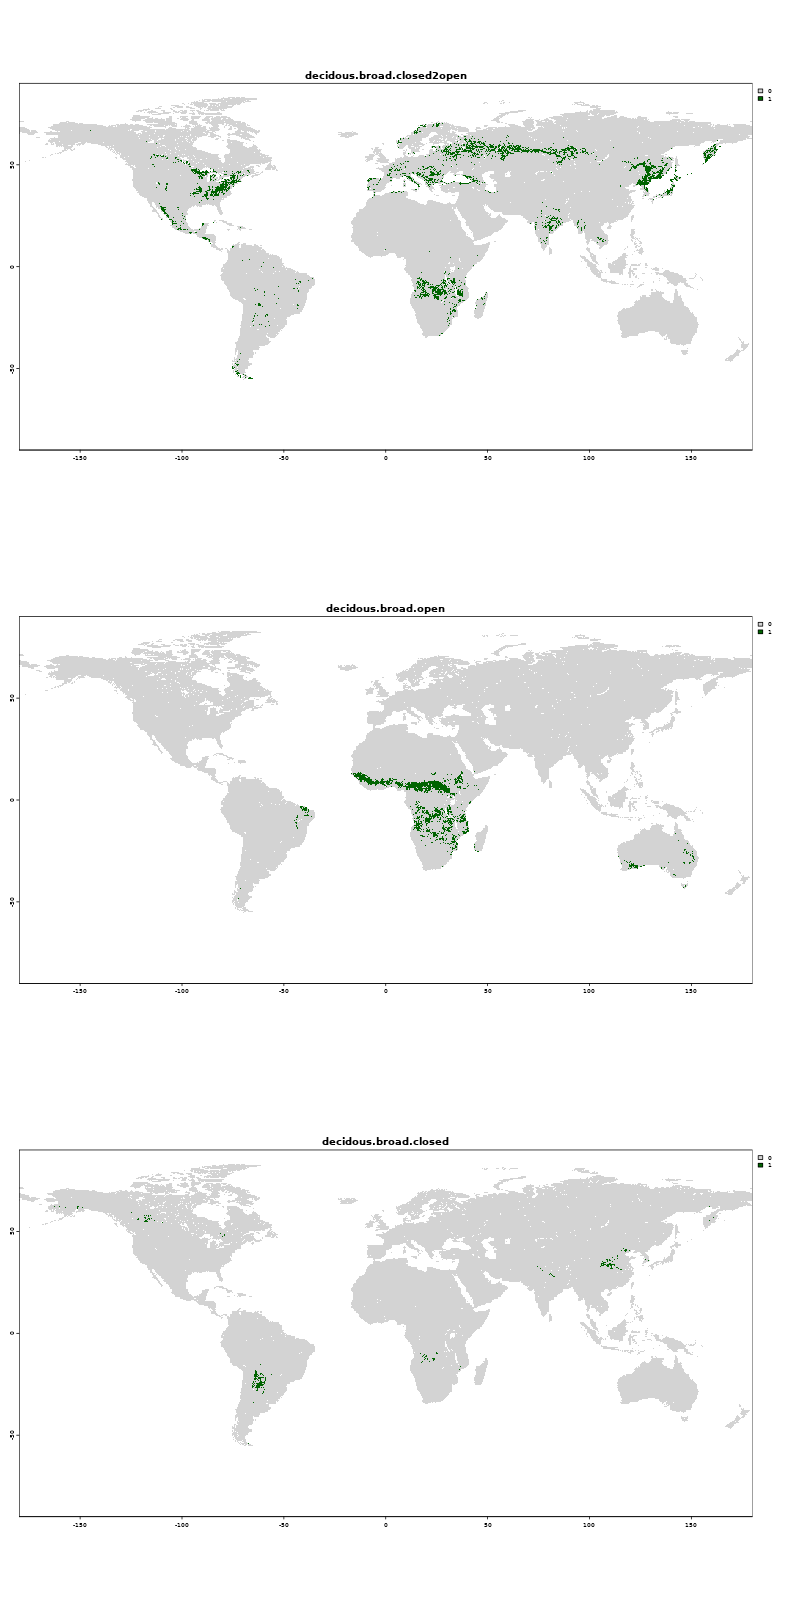
We have downloaded and analyzed the C3S-LC-L4-LCCS data from Land cover classification gridded maps from 1992 to present derived from satellite observations . After aggregating to 5min (working on the 300m data was too slow), we believe that the data differs from the documentation (http://dast.data.compute.cci2.ecmwf.int/documents/satellite-land-cover/WP2-FDDP-LC-2021-2022-SENTINEL3-300m-v2.1.1_PUGS_v1.1_final.pdf).
In the documentation it looks like there should be “summary-classes” e.g. 60 for “Tree cover, broadleaved, deciduous closed to open (>15%)” and further detailed subclasses for closed cover (>40%) and open cover (15-40%) (classes 61 and 62 for broadleaved, deciduous). However the areas of these subclasses are not included in the summary class, as can be seen in the attached plot for 2022. Are we misunderstanding the documentation (p.34)?
We appreciate any help on this.
Best,
Fabian