Hi
As explained in the documentation, if you use cdstoolbox.livemap.plot(...) with a shape that is the result of the cdstoolbox.shape.merge_array tool, a time slider will be added to the livemap.
Is there a way to format the time indicator on the time slider? There is a bit in the documentation about formatting shapes labels, but not the labels on the time slider.
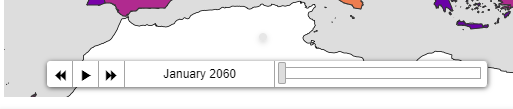
See the attached screenshot, I would like the time slider to show '2060' instead of 'January 2060'
Many thanks
Rutger
Dear Rutger,
You can use:
date_format='yyyy' # date format to use in the time slider
Here is an example:
https://cds.climate.copernicus.eu/toolbox-editor/gallery/18_dynamic_map_with_slider
The updated documentation for ct.livemap.plot has not made it to production yet but you can see it here:
https://cds-toolbox-dev.bopen.eu/toolbox/doc/tools/cdstoolbox.livemap.plot.html
Hope this helps.
Vivien
Thanks Vivien! That works perfectly.
If I may ask a different question... The documentation that you linked to gives some information on how to specify colours and contour levels, but I think this only applies to shapes? How can I specify colours for a single gridded data layer in a Livemap?
I couldn't immediately find a good example of this in any of the applications, either, so any pointers would be appreciated.
Thanks
Rutger
Dear Rutger,
As for now there is now way to customize a data layer in a Livemap.
The styling is all automatically driven by the long name of the variable.
More customization options might be available in the future.
Regards.
Vivien