Is there a map or data available which shows all measurement stations used in ERA5?
I want to know how many actual measurements are used for ERA5 data in Kenya (wind speeds and solar irradiation) or if large parts are based on interpolation.
Thx!
Is there a map or data available which shows all measurement stations used in ERA5?
I want to know how many actual measurements are used for ERA5 data in Kenya (wind speeds and solar irradiation) or if large parts are based on interpolation.
Thx!
Hi Jonas, this a difficult to answer, also for the reanalysis team, surface stations are only part of the data being assimilated, and not necessarily all their data is being used.
As a starting point, I’ve been using datasets such as GSOD Data Access | National Centers for Environmental Information (NCEI)
to locate weather stations that are likely part of the datas being assimilated (via the GTS possibly).
What is your use case? We’re in touch with the center about this question, as part of https://www.wemcouncil.org/wp/reanalysis-working-group/
BR
Rémi
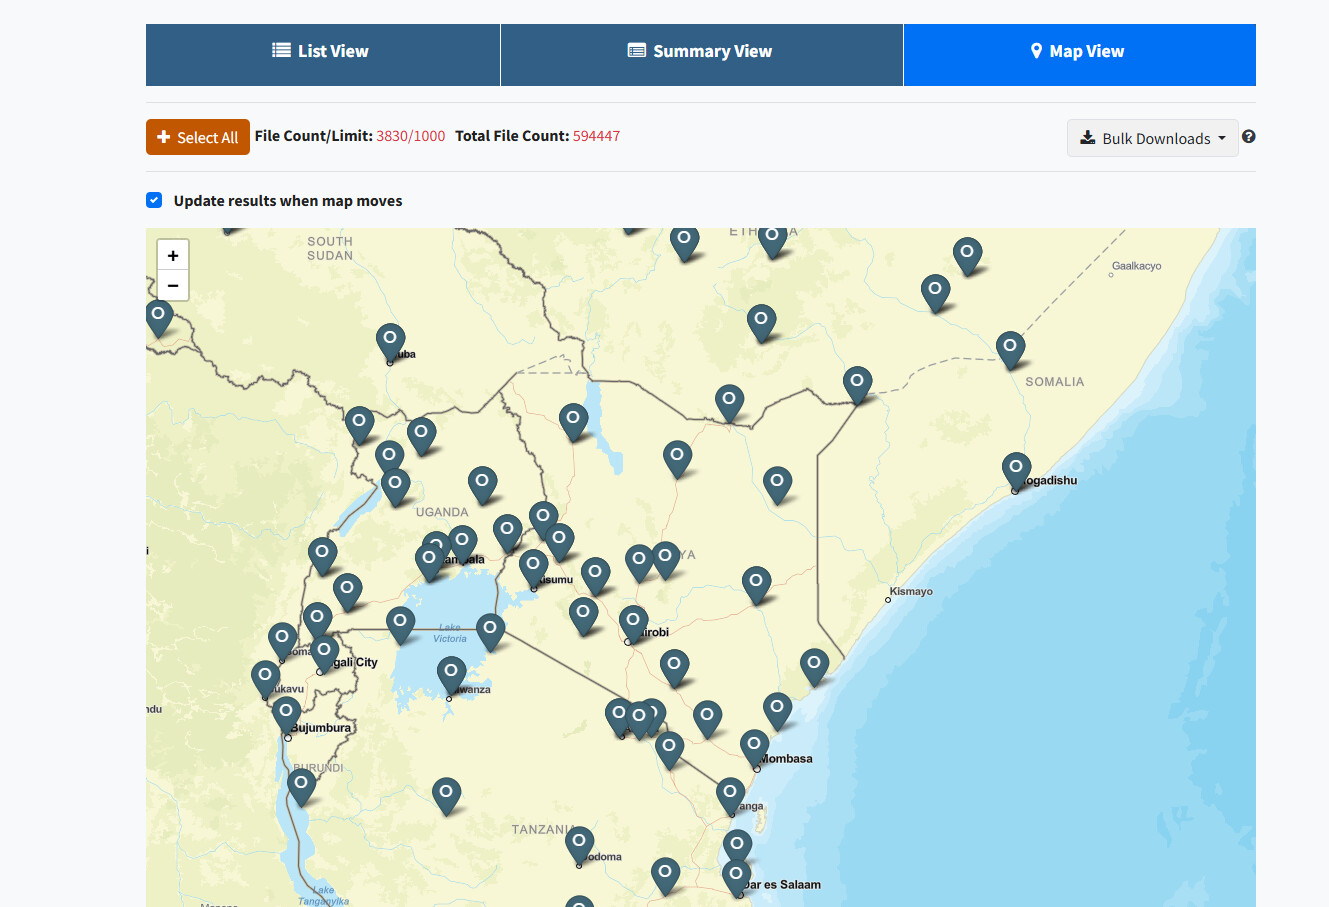
Thanks a lot Remi! I previously also asked you this question on LinkedIN. You directed me to this presentation (see figure below, but it only shows stations from 1940 -1949 for wind data) and a dataset from Copernicus.
Generally, the more actual observations are used in a region for the reanalysis, the more accurate it is, right?
Your source shows only a few measurement stations in Germany, but I thought there would be a huge amount feeding data into ERA5?
I am using the python package atlite to convert weather data from ERA5 into energy systems data (e.g. generation timeseries for wind and solar generators). As part of this, I wanted to show the measurement stations in Kenya.