We are pleased to announce that with the release of December 2023 forecasts (10th December 2023) a new view of the SST indices time series have been included for the ENSO regions in the C3S seasonal graphical products.
https://climate.copernicus.eu/charts/packages/c3s_seasonal/
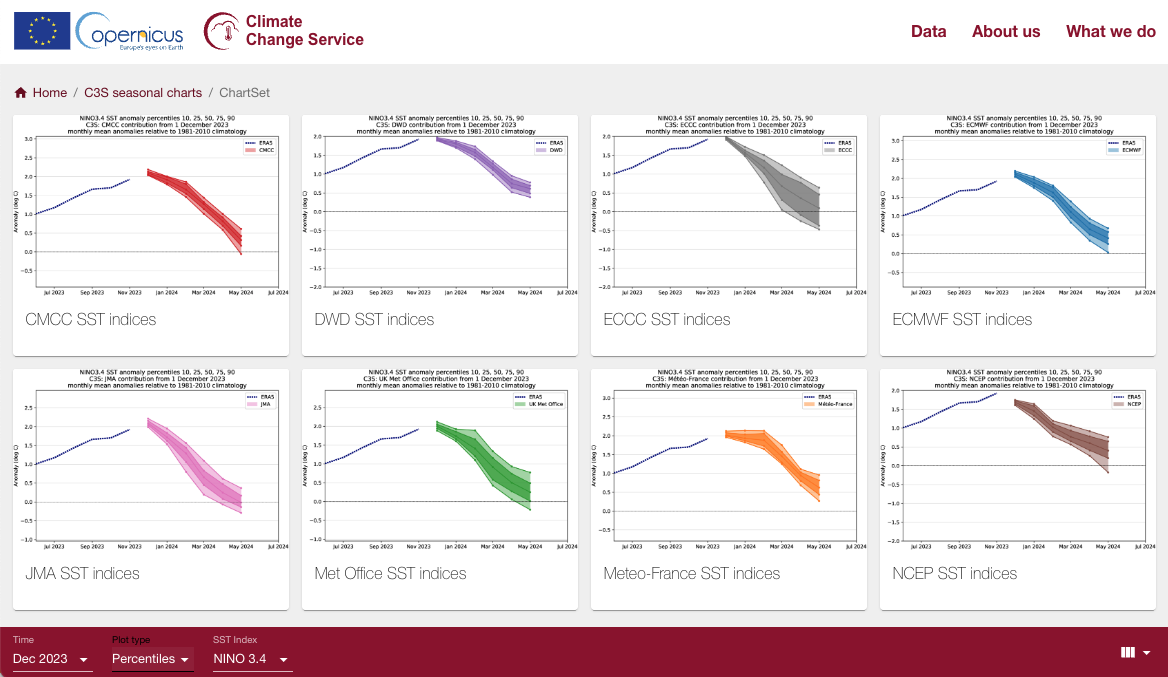
In addition to the plot showing individual ensemble members a new time series plot is now available showing some of the percentiles for each month's distribution. This was already available for the IOD indices and it has been now also extended to ENSO indices.
2 Likes
Thanks for sharing this, it's indeed very useful. Do you already have a possible date for the release of the ENSO forecasts in the CDS?
Can I find the code anywhere that is used to generate the monthly "wheatsheaf" plot of each ensemble's ENSO 3.4 value?
Hi @Matteo_De_Felice12
The publication of this kind of products as data in the CDS is something that has climbed up in our list of priorities and we are currently actively working on that. We hope we would be ready to publish the data at some point this year, but we don’t have yet well-defined timelines.
Thanks.
Best regards!
Hi @Richard_Dixon
unfortunately the code used to produce the numbers behind those plots is constituted by at least three different steps performed by different tools (step 1: from SST 2-D field to area averages for the NINO regions; step 2: computation of individual members plumes including anomaly computation and variance re-scaling; step 3: computation of percentile boundaries and plotting).
The first two steps are embedded in some tools with a wider angle and it would be difficult to encapsulate those bits in some shareable code. The third step would be easier to share as a python workflow, but at the same time it contains the (I guess) least interesting and more straightforward bit of computing (ranking/counting for the percentiles).
Having said that, with the advent of the next stage in the CDS infrastructure that it’s about to happen, our plans for seasonal prediction products is to produce more training materials and workflow examples, and we have indeed in our plans one such workflow to replicate the SST indices plots from end to end.
Unfortunately, the timelines for that are a bit blurry at the moment, I would say that end of 2024 could be feasible, but it might be affected by other routine/operational tasks taking over priority (we are expecting quite a few forecasting system upgrades this year).
Thanks for your interest!
Best regards!
Dear @Eduardo_Penabad,
thanks for sharing this update with us. Indeed, I can imagine you are very busy right and it’s very useful to have at least a tentative timeline (end of 2024?).
Regarding the methodology and the three steps you mentioned, is in the Confluence a more detailed explanation? In particular for the second step.
Hi again,
we do have some brief descriptions of all the products here:
https://confluence.ecmwf.int/display/CKB/C3S+seasonal+forecast+product+descriptions
Is this enough for your needs? or what do you find missing from there in this respect?
Thanks!
For the SST indices, there are a couple of obscure points.
For example:
- “The anomalies are computed relative to ERA5 climatology, after the start- and lead-time dependant bias in the absolute values has been removed based on the common hindcast period.”
- "a (capped) multiplication factor is applied to the index time series, which matches the model and observed variance of anomalies. "
I would like to try to reproduce the methodology but now I wonder if it would be faster to directly digitize the charts you publish while I wait for the data coming to the new CDS.
@Eduardo_Penabad may I ask you if you have any updates on the possibility to publish ENSO time-series in the CDS?
@Eduardo_Penabad are you planning to publish SST time-series in the CDS soon?
Hi Matteo,
Thanks for your continued interest in this. The encoding and publication of the data behind the graphical products will still take some time. We do have some draft notebooks available on reproducing some of our graphical products, and deriving NINO indices and related verification (these will be supplemented with additional examples over time): Workflows related to graphical products — c3sSeasonal
However, the NINO indices there are not directly comparable to those anomalies in the plots, which are variance-scaled, and also rebased to 1981-2010, as explained here: C3S seasonal forecast product descriptions - Copernicus Knowledge Base - ECMWF Confluence Wiki
When a catalogue entry including the data used in the graphical products is available we will post an announcement in the usual places.