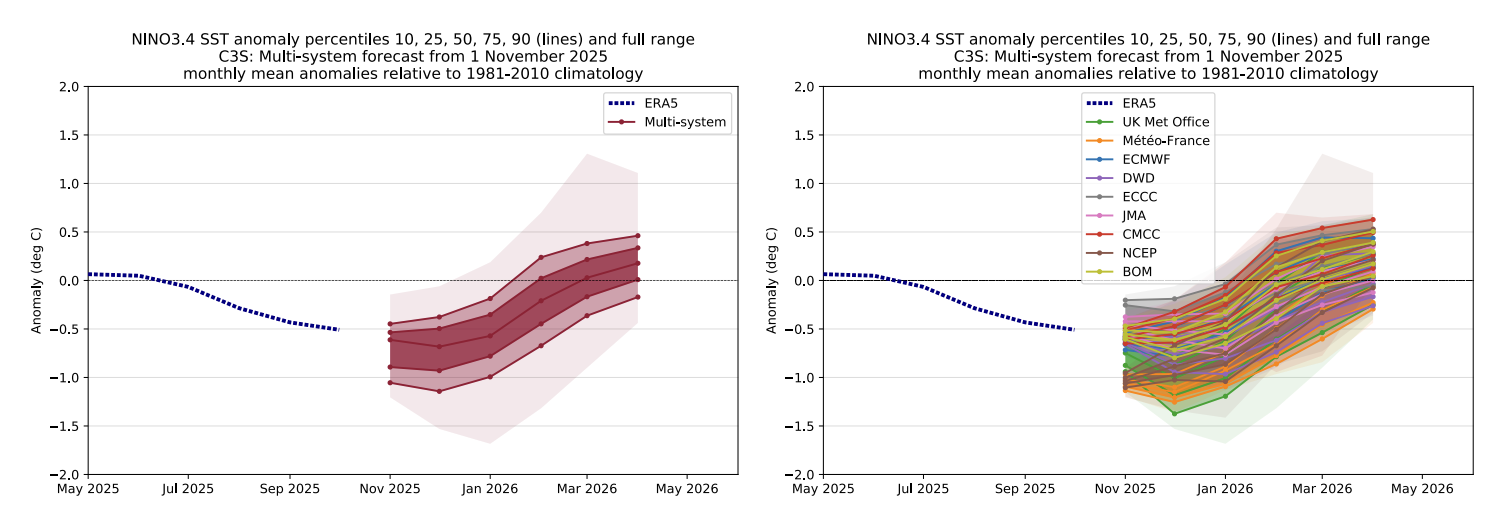
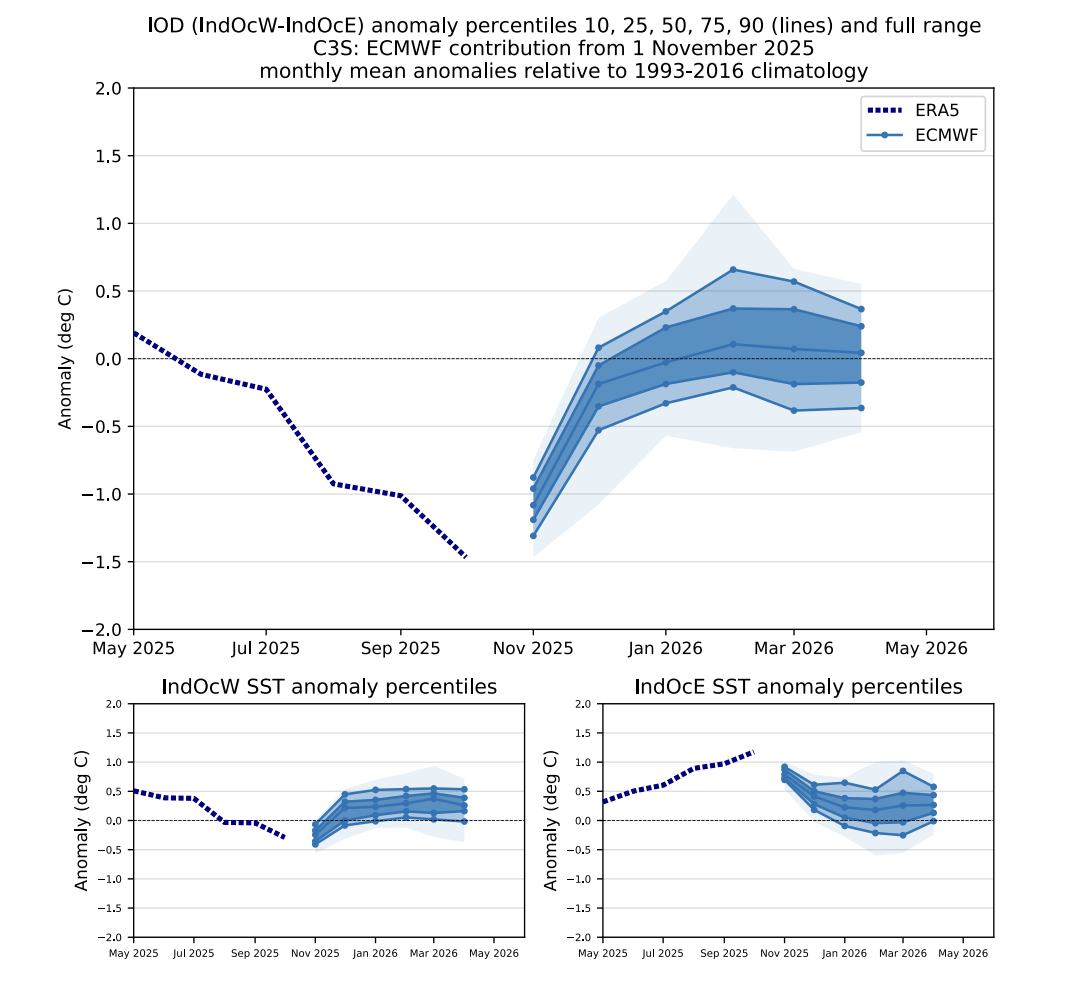
With the release of November 2025 real-time forecast a couple of new additions have been made to the SST indices plots showing the ensemble distribution percentiles
-
Multi-system: a new panel showing the grand-ensemble distribution has been added to the plot where all the individual contributing systems where shown together.
-
Individual forecast systems: the full range of the distribution (from minimum to maximum values) has been added with a paler shade to each one of the forecast plume plots.
(see in C3S seasonal charts viewer here)
(see in C3S seasonal charts viewer here)