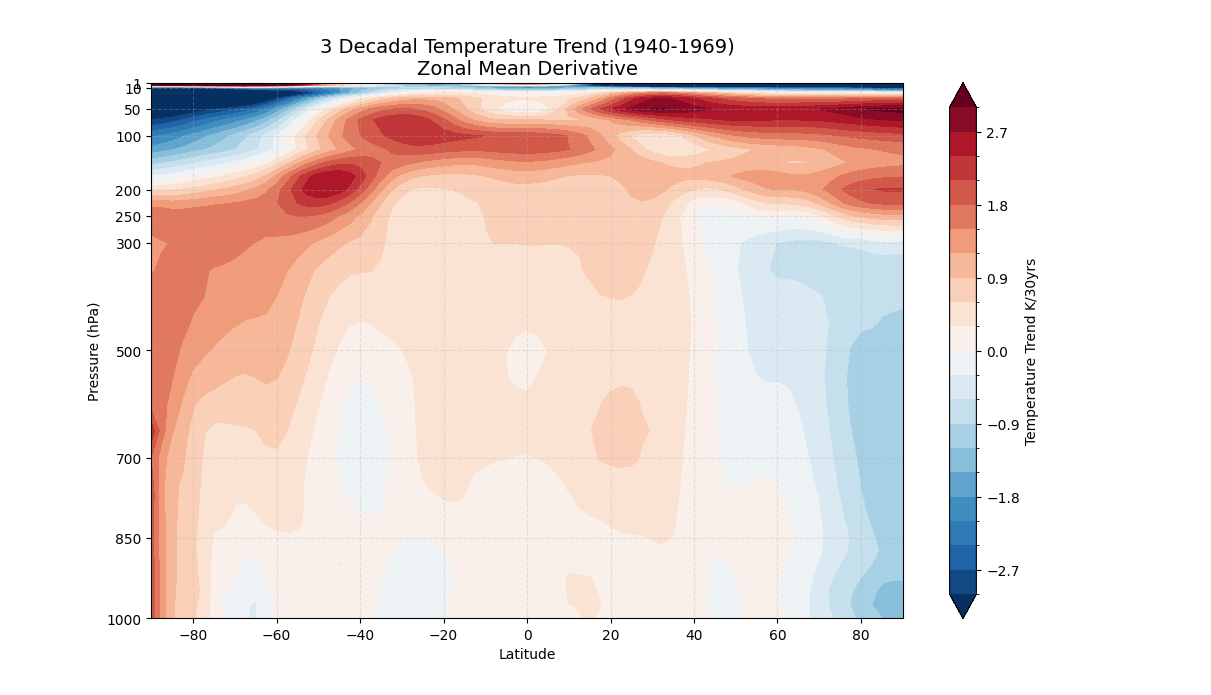
Hello , a fellow undergrad here! When i plot the temp trend over the 1940 to 1969 i see a spike of heating in the lower stratosphere. Something between +1.5 to +2K per 30yrs. I’m trying to understand if the data is not that reliable (since we talking about a pre-satellite era, with nearly non existent measurements for the upper atmosphere) or maybe the volcanic eruption of 1963 shifts my polyfit higher. Any suggestions ?
Dear Christos,
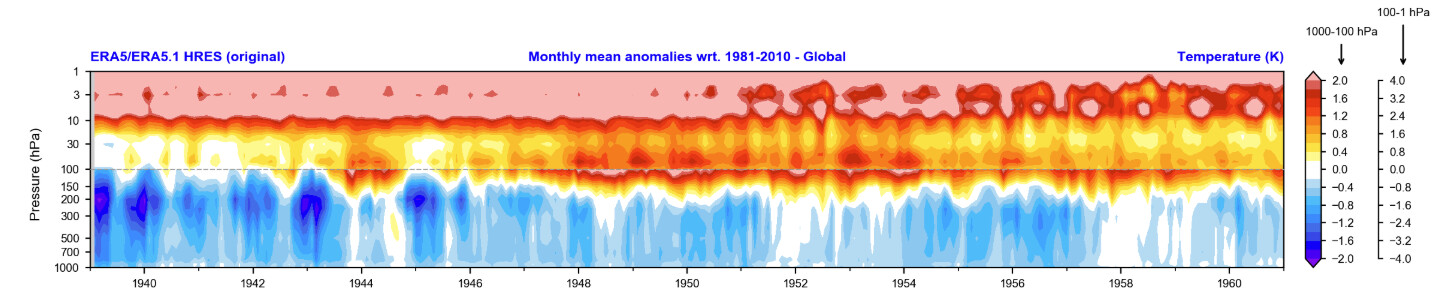
before 1946 we didn’t really have radiosonde observations. Since the model used in ERA5 has a cold bias in the lower stratosphere, the lack of such observations means that this cold bias is not corrected in the ERA5 reanalysis in the early 1940s. So, the ERA5 lower stratosphere is too cold in that era, which is inline with your warming trend between 1940-1969.
Attached an anomaly pressure-time plot for the global mean anomaly.
How do your results look if you discard the 1940s?
Regards, Hans