Dear all,
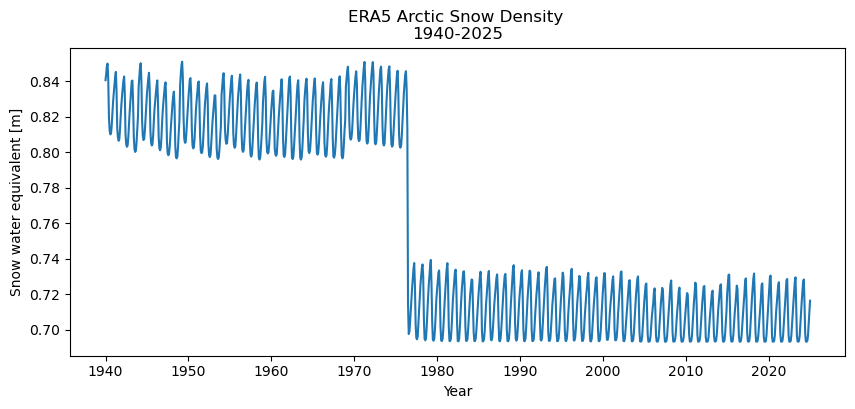
I am analyzing ERA5 snow density data over the Arctic (60–90°N) and noticed a sudden drop in the monthly mean values between June and July 1976, from ~0.83 m (w.e.) to ~0.71 m (w.e.). This pattern appears in both the 0.25° ERA5 product (DOI link) downloaded via the CDS API and the hourly data retrieved on the native grid from ECMWF Mars.
I could not find any documentation or literature explaining this change. Could you provide any insights into why this drop occurs? Any feedback is highly appreciated.
Kind regards
Angelika
P.S. To reproduce the plot:
import cdsapi
dataset = “reanalysis-era5-single-levels-monthly-means”
request = {
“product_type”: [“monthly_averaged_reanalysis”],
“year”: [str(y) for y in range(1940, 2026)],
“month”: [f"{m:02d}" for m in range(1, 13)],
“time”: [“00:00”],
“data_format”: “netcdf”,
“download_format”: “zip”,
“variable”: [“snow_depth”],
“area”: [90, -180, 60, 180]
}
client = cdsapi.Client()
client.retrieve(dataset, request).download()
and then in y jupyter notebook:
import os
import xarray as xr
import pandas as pd
import matplotlib.pyplot as plt
data_path = os.path.join(os.environ[‘HOME’], ‘cds_tmp’)
os.chdir(data_path)
ds = xr.open_dataset(‘data_0.nc’)
ds_spatmean = ds.sd.mean((‘latitude’, ‘longitude’))
#-- create time series plot
fig, ax = plt.subplots(figsize=(10,4))
ax.set_title(f’ERA5 Arctic Snow Density \n’+
‘1940-2025’)
ax.plot(ds_spatmean.valid_time, ds_spatmean);
ax.set_ylabel(‘Snow water equivalent [m]’);
ax.set_xlabel(‘Year’);
Look at the data around where the jump occurs
#df = ds_spatmean.to_dataframe().reset_index()
#df_filtered = df[df[“valid_time”].dt.year.between(1976, 1977)]
#print(df_filtered)