I downloaded the total precipitation for the Indian Ocean January 1966 using the following API request:
import cdsapi
dataset = “derived-era5-single-levels-daily-statistics”
request = {
“product_type”: “reanalysis”,
“variable”: [“total_precipitation”],
“year”: “1966”,
“month”: [“01”],
“day”: [
“01”, “02”, “03”,
“04”, “05”, “06”,
“07”, “08”, “09”,
“10”, “11”, “12”,
“13”, “14”, “15”,
“16”, “17”, “18”,
“19”, “20”, “21”,
“22”, “23”, “24”,
“25”, “26”, “27”,
“28”, “29”, “30”,
“31”
],
“daily_statistic”: “daily_sum”,
“time_zone”: “utc+00:00”,
“frequency”: “1_hourly”,
“area”: [0, 0, -47, 120]
}
client = cdsapi.Client()
client.retrieve(dataset, request).download()
=====================
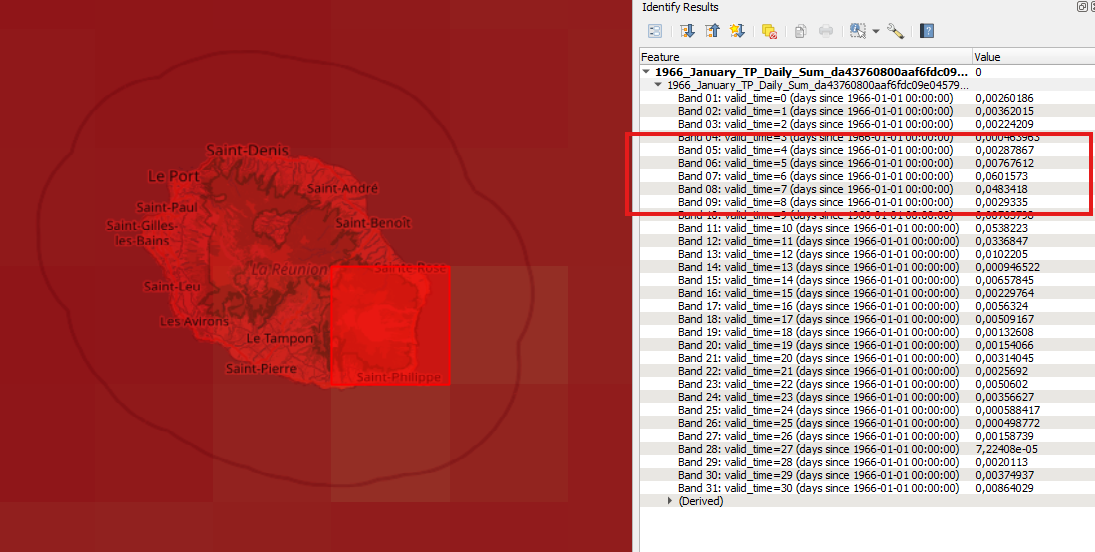
According to several sources, 1,825 mm (71.9 in); Réunion, 7–8 January 1966, during Tropical Cyclone Denise. However, when looking at the nearest grid cell over Reunion, we get a daily sum for those days of merely 0.060 and 0.048 m, while I would expect something of the order of 1 m. Is it a peculiarity of the dataset not to represent such events or am I interpreting something wrong?
Thank you!