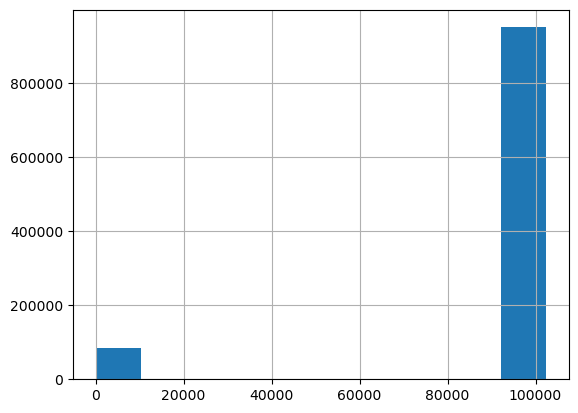
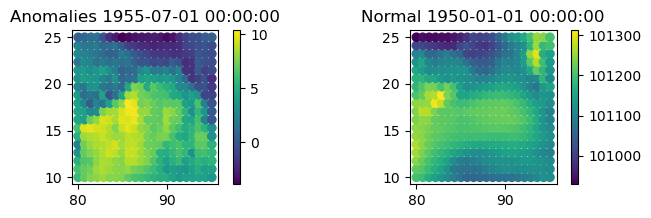
I have downloaded the mean sea level pressure from 1950-1955 over the Bay of Bengal and calculated the daily maxima but I am getting some unusual values in 1955 ranging from -10 to 10. Anyone have any idea why this might be?
Hi,
please have a look here: Check your recent NetCDF files downloaded from the CDS and ADS: you may need to download them again
Thanks