Hello everyone,
I am doing some analysis with transpiration values. For this I downloaded the variable ‘Evaporation from Vegetation Transpiration’ from ERA5 Land Hourly data. Time range is 1 Jan 2010 to 31 Dec 2013. I downloaded the data as netCDF files for Bavaria in Germany. Since there was one file downloaded for every month, I merged all 48 files into one using xarray in python (xarray.open_mfdataset)
For further processing, I converted all the positive values to 0 (since they represent condensation and not transpiration). I also converted all the negative values (actual transpiration values) to positive for ease of processing. I multiplied the values by 1000 to convert from meters to millimeters.
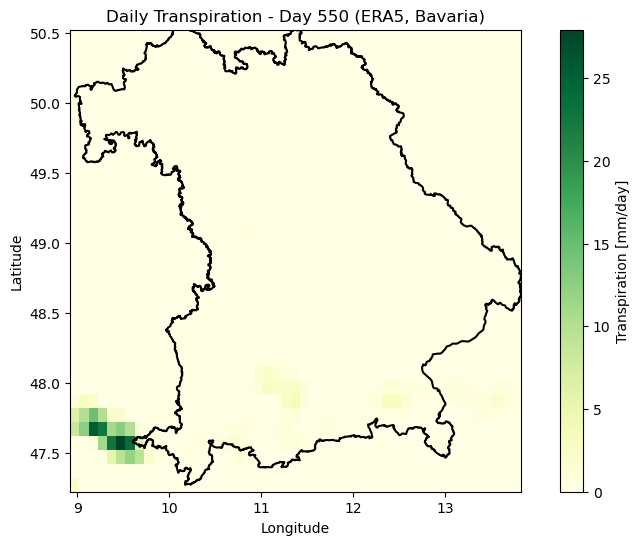
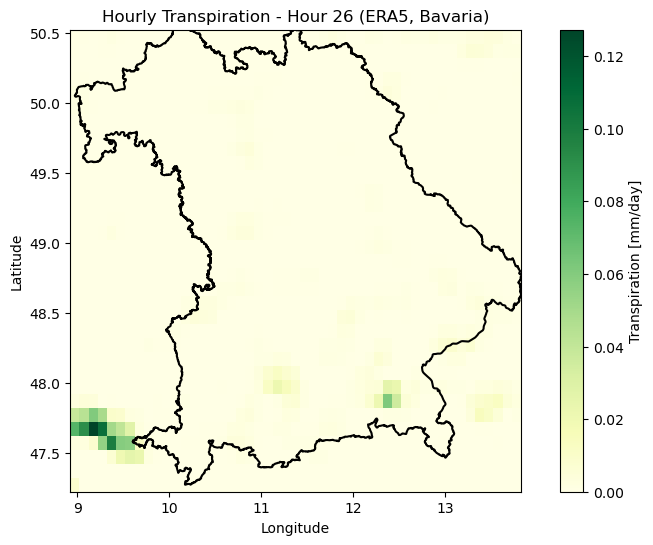
Now when I check the data the transpiration values are extremely high. Please see the attached plots. For some hours the value goes as high as 0.78 mm per hour. If I sum the hourly values for a day, transpiration can be as high as 50mm per day, which is sometimes the monthly rainfall in some parts of Bavaria.
From the figures it seems the high values are usually in the same location.
I am not sure what is going wrong? Is it something with my code in python (I checked this multiple times but I can still share the code)
Or is it something to do with the data itself?
Any help on this matter will be highly appreciated.
With kind regards,
Karan
Please note: In the figures the day and hour both start from 1 January 2010.
The variable is accumulated.
This variable is accumulated from the beginning of the forecast time to the end of the forecast step.
You can read about accumulations here ERA5-Land: data documentation - Copernicus Knowledge Base - ECMWF Confluence Wiki
Hi
Thanks a lot for your reply. This was indeed one of the problems. When computing the daily value, I just had to take the value at the 00 hour of day D+1 to get the daily sum for day D. Instead I was summing all the 24 values for day D which was wrong because its an accumulated variable.
Another problem was that in ERA5-Land hourly data, the evaporation values are swapped. So while I downloaded transpiration data, the downloaded data actually represented evaporation from open water bodies. Hence the very high values of transpiration in my figures above are actually representing evaporation above these water bodies: Lake Constance, Ammersee, and Chiemsee in Germany. This is also why values above land are almost 0: because there is no open water for evaporation.
Hello,
I am doing some analysis with transpiration too. I found the dataset isn’t transpiration, it is evaporation from water surfaces.
So, i want to know how you got the correct transpiration data finally.
I hope to your answer.
Kind regards.
Hello.
If you check the documentation of ERA5-Land, you will see in the known issues section that the values in the downloaded dataset are swapped. I think the variable ‘evabs’, which is supposed to have values for evaporation, actually has values for transpiration. So if you want transpiration, use evabs.
Also, the units are in m so multiply by 1000 to get values in mm. Also for consistency, I make all the positive values as 0 (condensation) and I change all the negative values to positive to get positive transpiration.
With kind regards,
Karan
Thank you for your attention.
I’m going to try to download the variable ‘evabs’.
Sincerely,
Liu